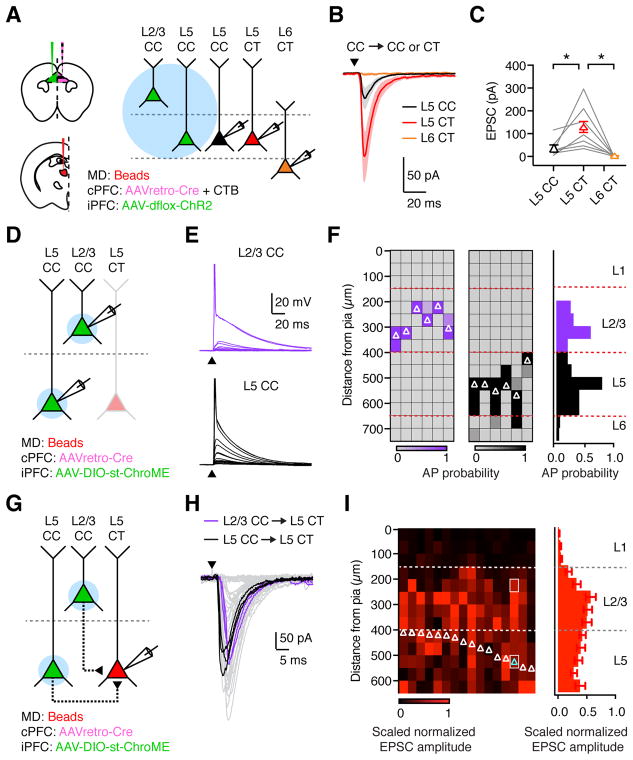
Figure 8. CC neurons in PFC preferentially contact L5 CT neurons.
(A) Left: Injections of retrobeads in ipsilateral MD, AAVretro-Cre and CTB in contralateral PFC, and AAV-dflox-ChR2 in ipsilateral PFC. Right: recordings from retrogradely-labeled L5 CC, L5 CT, and L6 CT neurons during stimulation of local CC inputs.
(B) EPSCs recorded at −70 mV from triplets of L5 CC (black), L5 CT (red), and L6 CT (orange) neurons in response to optogenetic stimulation of local CC neurons.
(C) Summary of EPSC amplitudes, where lines represent individual triplets.
(D) Following similar injections to (A), but expressing st-ChroME in the ipsilateral PFC, recordings were made from pairs of st-ChroME-infected L2/3 and L5 CC neurons.
(E) Light-evoked depolarizations and action potentials (APs) from paired st-ChroME-expressing L2/3 CC (purple, top) and L5 CC (black, bottom) neurons, showing response to stimulation at different locations from the pia (0–700 μm, at 50 μm increments). Y–axis truncated to better highlight subthreshold responses.
(F) Left: Light-evoked AP probability for pairs of st-ChroME-expressing L2/3 (purple) and L5 (black) CC neurons at varying distances from pia. Each column is an individual cell, with recordings ordered pairwise from left to right. Soma locations of recorded neurons are indicated by white triangles. Right: Summary of AP probability versus distance from pia.
(G) Following similar injections to (D), recordings were made from L5 CT neurons.
(H) CC-evoked EPSCs from L5 CT neuron, showing responses from multiple trials recorded from a single cell, cyan triangle in (I), after stimulation at different locations from the pia. L2/3 (purple) and L5 (black) responses are highlighted, corresponding to white boxes in (I).
(I) Left: CC-evoked EPSCs from L5 CT neurons at varying distances from pia. Each column is a recorded neuron whose soma is indicated by a triangle. Responses are peak-normalized within each neuron and scaled to account for differences in AP probability in L2/3 and L5 CC neurons. Right: Summary of scaled peak-normalized EPSC amplitude at varying distances from pia.
Values are mean ± SEM (C, F, I). * = p < 0.05
See also Figure S8

