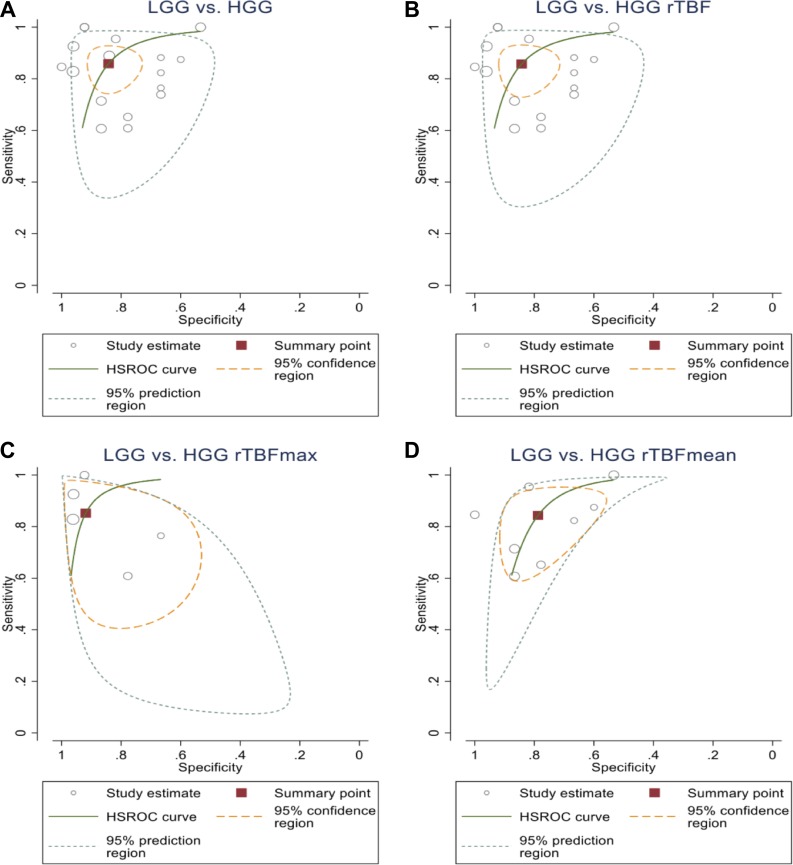
Figure 4. HROC plot shows the summary point of the sensitivity and the specificity (square) and its 95% CI (the green curve).
(A) from all of the analysed ASL parameters to differentiate between HGGs and LGGs (86%, CI (78%, 91%)) and (84%, CI (76%, 90%)), respectively; (B) rTBF to differentiate between HGGs and LGGs (86%, CI (77%, 91%)) and (84%, CI (76%, 90%)), respectively; (C) rTBFmean to differentiate between HGGs and LGGs (84%, CI (71%, 92%)) and (79%, CI (66%, 88%), respectively; (D) rTBFmax to differentiate between HGGs and LGGs (85%, CI (69%, 94%)) and (92%, CI (80%, 97%)).

