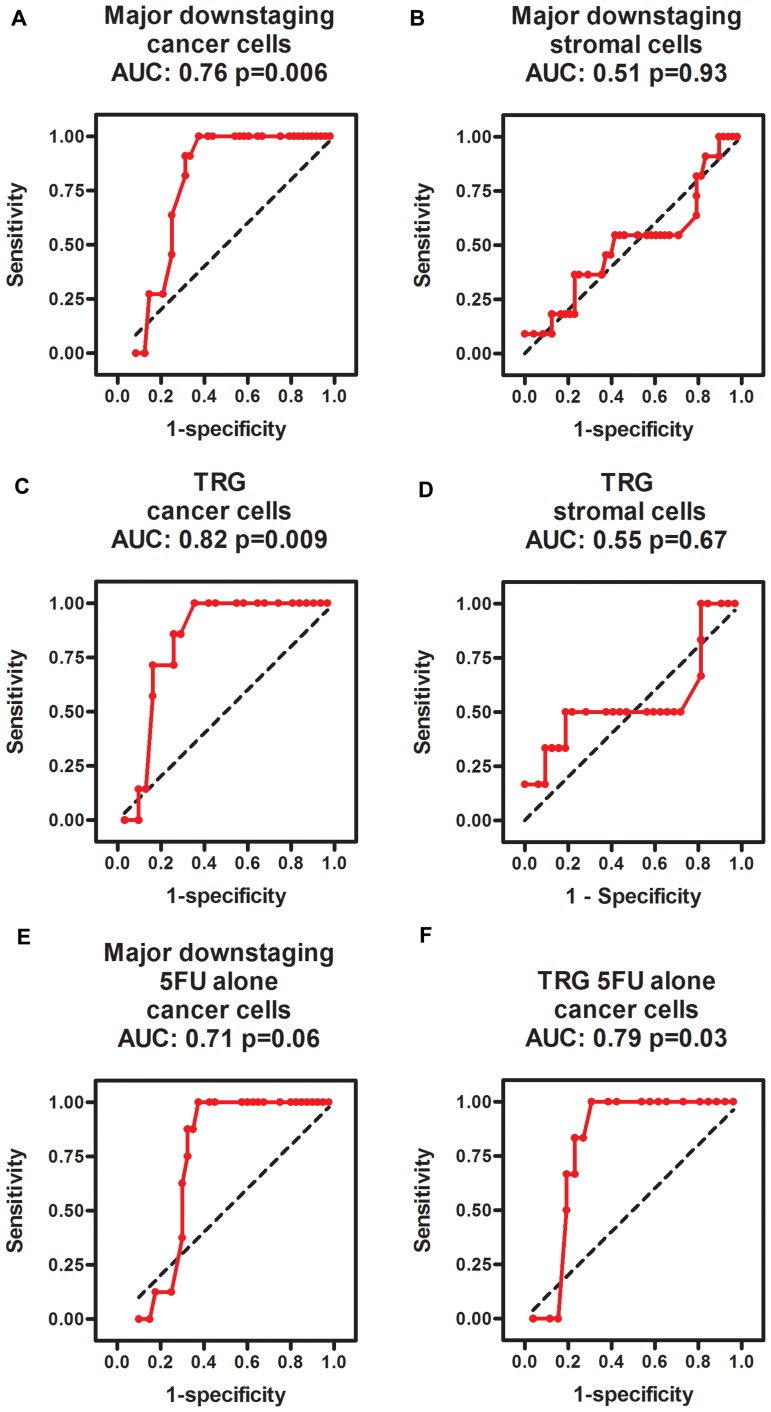
Figure 3.
ROC diagrams showing the predictive power of phospho-ERK scores in cancer cells (A, C, E, F) but not in intertwining stromal cells (B, D) for predicting major downstaging (A, B, E) and TRG1 (C, D, E, F) in all patients (A–D) as well as the subgroup of patients treated with 5FU alone (E, F). The black dotted line in each diagram illustrates an imaginary line of no predictive power (AUC = 0.5).

