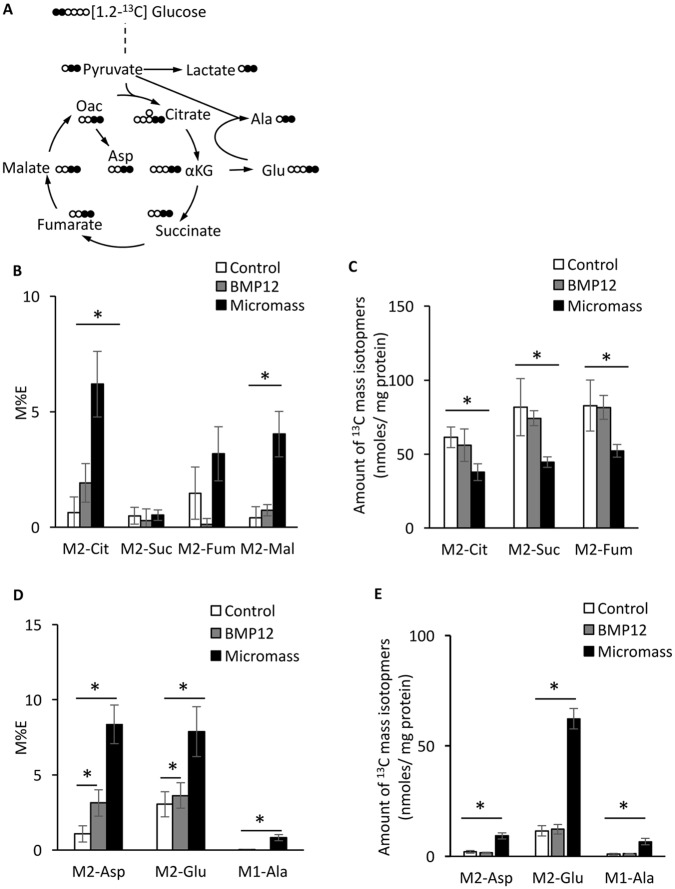
Fig 3. Flux of [1,2-13C] glucose to TCA cycle and amino acids derived from TCA cycle intermediates.
The sample preparation is described in the legend of Fig 2. (A) Carbon fate map showing the isotopomer distribution of indicated metabolites, intermediates and amino acids derived from [1,2-13C] glucose. (B and C) 13C-enrichment (B) and amounts (C) of M2-citrate (M2-Cit), M2-succinate (M2-Suc), M2-fumarate (M2-Fum) and M2-malate (M2-Mal) in the cell layer. (D and E) 13C-enrichment (D) and amounts (E) of M2-aspartate (M2-Asp), M2-Glutamate (M2-Glu) and M2-alanine (M2-Ala) in the cell layer. The values are average +/- SD. n = 4 per group. *, p<0.05.

