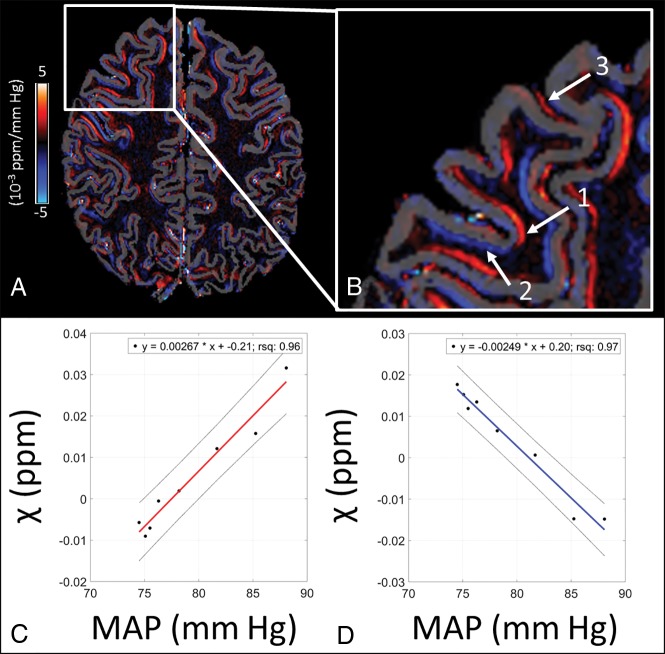
Fig 3.
CVC map with a semicortical mask (A) and a zoomed inlay (B) showing regions with mainly arterial (arrow 1), venous (arrow 2), and pial arterial (arrow 3) contributions. In regions with predominantly arterial vessels (arrow 1), the susceptibility increases with increasing MAP (C), while it decreases in regions with predominantly venous vessels (arrow 2) with increasing MAP (D). The slope of the regression lines in C and D represents the CVC. rsq indicates the square of the correlation coefficient.

