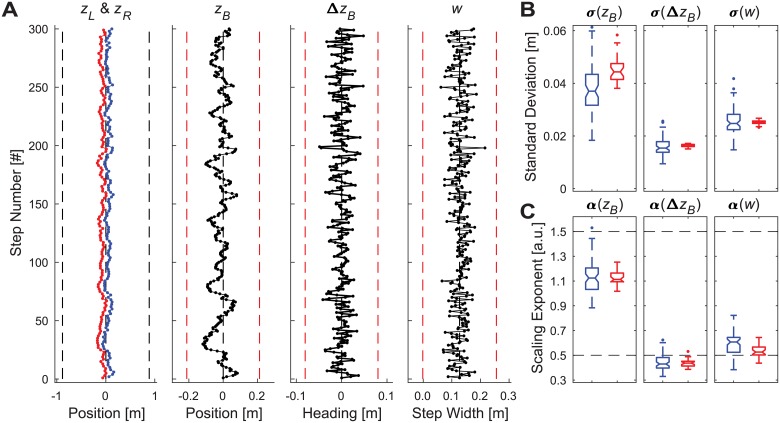
Fig 4. Typical model simulation results for multi-objective position-step width control.
A) Example time series data for a single representative trial simulated for baseline parameter values (see S2 Appendix) and a control proportion that was weighted at 93% step width / 7% position control. The time series plotted, axes, and axis limits are all the same as in Fig 2. B) Standard deviation (σ) and (C) DFA scaling exponent (α) values for all trials for each variable (zB, ΔzB, and w). Each subplot in (B) and (C) shows boxplots for the experimental data (blue–left; from Fig 2) and for 30 representative simulated trials from the model (red–right) using the same parameter values as in (A). All boxplots were constructed in the same manner as described in Fig 2.

