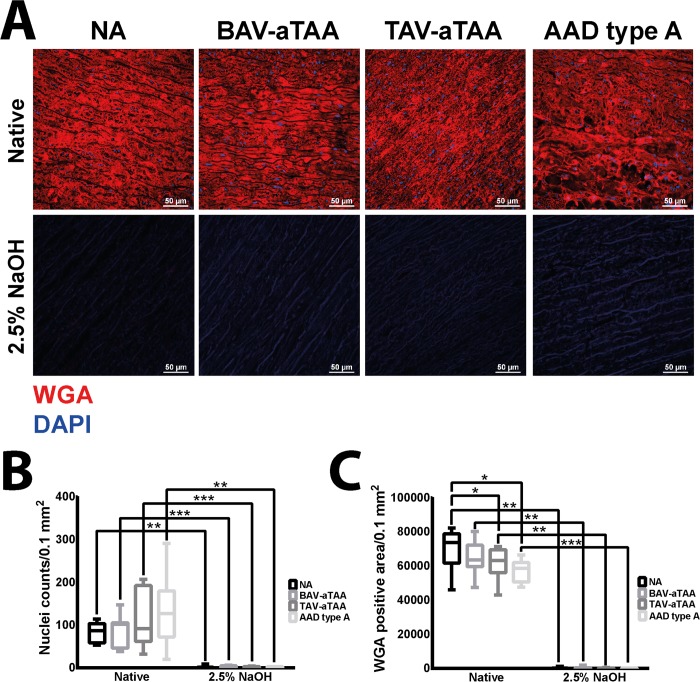
Fig 1. Determination of decellularization extent in NA as well as aneurysmal/dissection tissue of different origin.
In (A) upper row, the native tissues of the corresponding groups are shown. In blue the cell nuclei are depicted and in red the plasma membrane is shown by WGA staining. In the row below, representative images of corresponding decellularized tissues are depicted. Scale bar represents 50μm. (B) Quantification of cell nuclei and (C) WGA positive staining are shown using box plots with mean and standard deviation. NA n = 9; BAV-aTAA n = 9; TAV-aTAA n = 9; AAD type A n = 8. * p<0.05, ** p<0.01, *** p<0.001.

