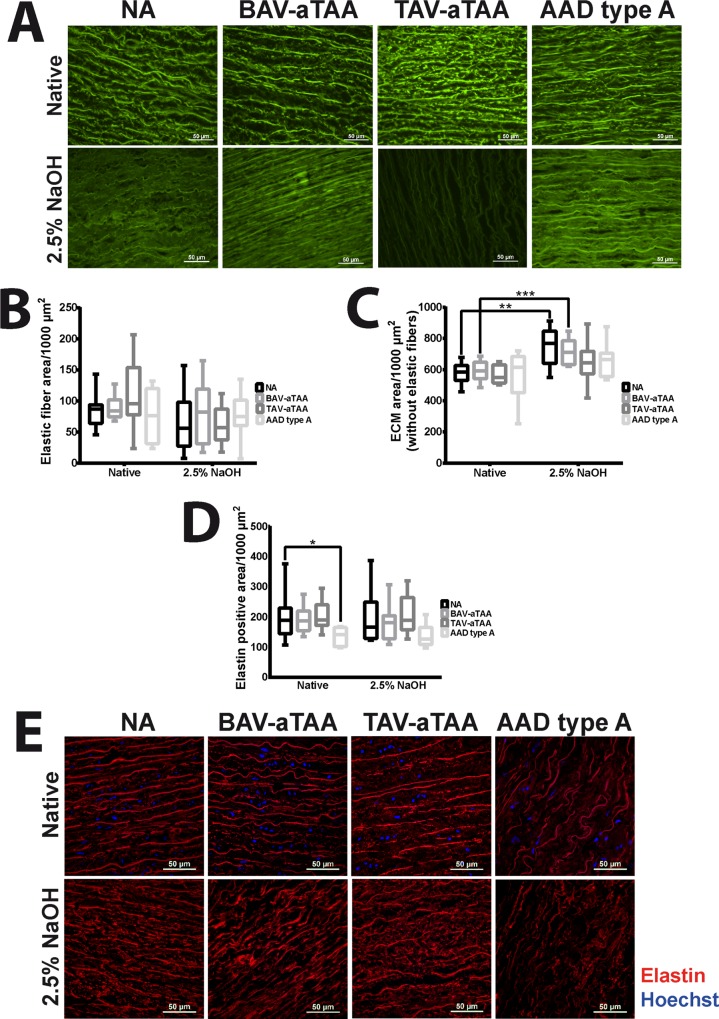
Fig 2. Quantification of ECM components of NA and aneurysmal/dissection tissues.
(A) Representative images of the auto-fluorescence properties of elastic fibers and other ECM components to quantify the ECM of native and decellularized tissue are shown (elastic fibers with stronger auto-fluorescence in GFP-B channel compared to residual ECM). Scale bar represents 50μm. In (B) and (C) the quantification of elastic fiber area as well as ECM area without elastic fibers are shown in box plots with mean and standard deviation. Box plots in (D) show the quantification of elastin expression in native as well as decellularized NA and aneurysmal/dissection tissue. (E) shows representative images of antibody specific elastin staining (shown in red) in native and decellularized NA and aneurysmal/dissection tissue. Cell nuclei depicted in blue are stained with Hoechst. NA n = 9; BAV-aTAA n = 9 and for elastin n = 8; TAV-aTAA n = 9; AAD type A n = 8. * p<0.05, ** p<0.01, *** p<0.001.

