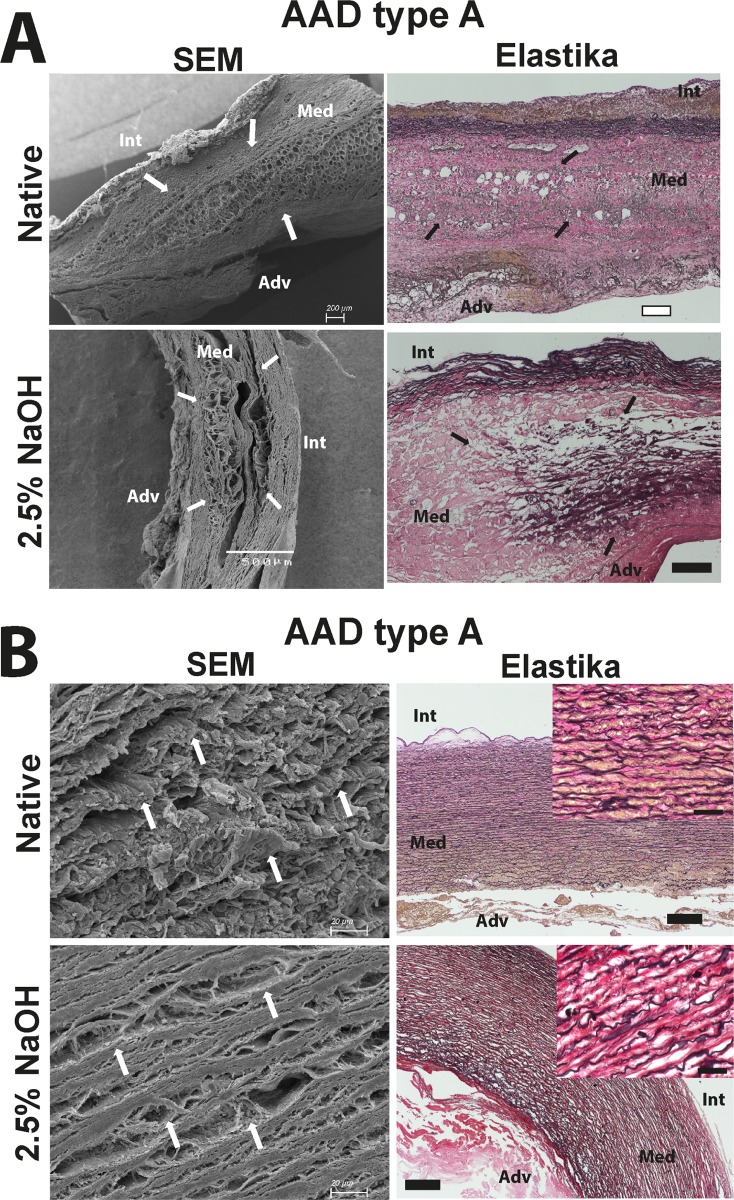
Fig 7. Representative images indicating the dissection lamellae and the ECM structure of aortic dissection specimens aside from the dissection lamellae.
In (A) overview pictures of the dissection lamellae (white/black arrows) before and after decellularization are shown using SEM-based image acquisition and the corresponding tissue specimen after Elastika van Gieson staining. (B) Representative SEM images of the ECM structure in native and decellularized dissection tissue aside from the dissection lamellae and the corresponding pictures of Elastika van Gieson staining. White scale bar represents 200μm and black scale bar 250μm. Scale bar in the small pictures (magnification x40) represents 50μm. Int = intima; Med = media; Adv = adventitia.

