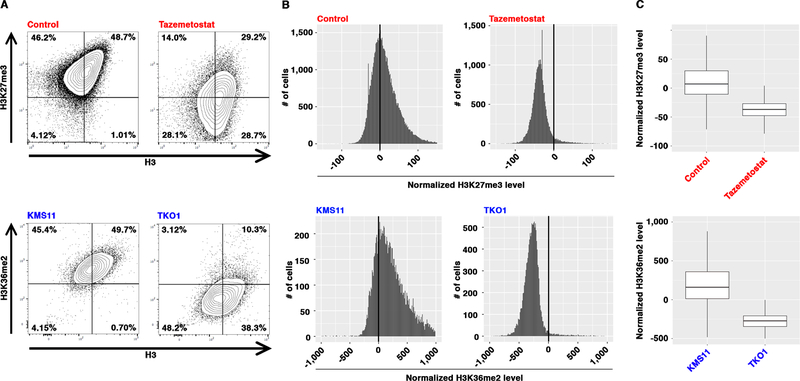
Figure 2. Normalization of EpiTOF Data.
(A) Raw EpiTOF data. Mass cytometry analysis of control (DMSO) and Tazemetostat-treated Jurkat cells (top) or KMS11 and TKO1 cells (bottom) using the indicated antibodies. Contour plots: x-axis, antibodies against total histone H3; y-axis, antibodies against H3K27me3 (top) or H3K36me2 (bottom). Percentage of cells in each quadrant is shown.
(B) Distributions of linear regression residuals of EpiTOF data. Histograms of linear regression residuals of the data in (A). x-axis, residual levels; y-axis, numbers of cells with given residual levels; top, H3K27me3 in DMSO (left)- or Tazemetostat (right)-treated Jurkat cells; bottom, H3K36me2 in KMS11 (left) or TKO1 (right) cells.
(C) Normalized EpiTOF data. Box plots show the normalized H3K27me3 (top) or H3K36me2 (bottom) levels of the cells in (B). y-axis, normalized chromatin mark levels (residuals of a linear model using total H3 as predictor variable).

