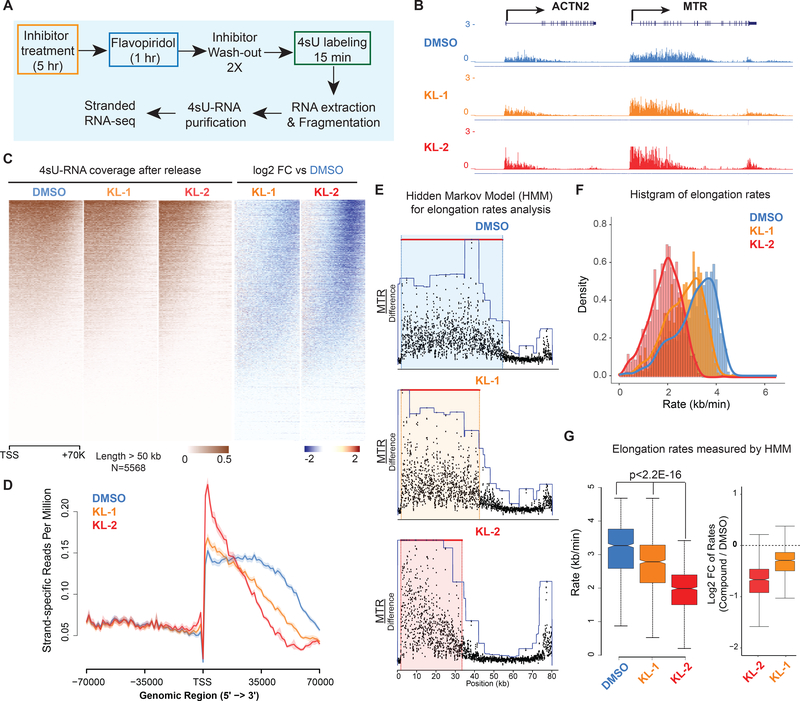
Figure 4. Small molecule disruption of SEC slows Pol II elongation rates.
(A) Workflow of 4sU-FP-seq based measurement of transcription elongation rates. HEK293T cells were pretreated with vehicle or 20 μM SEC inhibitors for 5 hr before addition of the CDK9 inhibitor flavopiridol for 1 hr to arrest Pol II at the promoter-proximal pause site. Inhibitors are washed out with PBS before allowing transcription to proceed in the presence of fresh medium containing 500 μM 4-Thiouridine (4sU) for 15 min. The 4sU-labeled RNA was extracted and fragmented before purification, and followed with RNA-seq.
(B) Genome browser tracks of 4sU-FP-seq for vehicle and SEC inhibitor-treated cells at the ACTN2 and MTR loci.
(C) Heatmap analysis of 4sU-FP-seq in vehicle and the indicated SEC inhibitors in HEK293T cells. All genes longer than 50 kb (N= 5,568) were plotted and ordered using the total 4sU-FPseq signals in the vehicle-treated cells.
(D) Metaplot of strand-specific 4sU-FP-seq signals in vehicle and SEC inhibitors-treated cells.
(E) Hidden Markov Model (HMM) for elongation rate analysis. Raw changes in 4sU-FP-seq read counts in non-overlapping 50 bp windows were used to infer elongation rates for the MTR gene. Boxes show the span of advancing wave inferred by a 3-state HMM analysis.
(F-G) Histograms (F) and boxplots (G) comparing transcription elongation rates for 982 genes in HEK293T cells for which high confidence elongation rates could be determined. Statistical analysis was performed with the Wilcoxon test. See also Figure S4.

