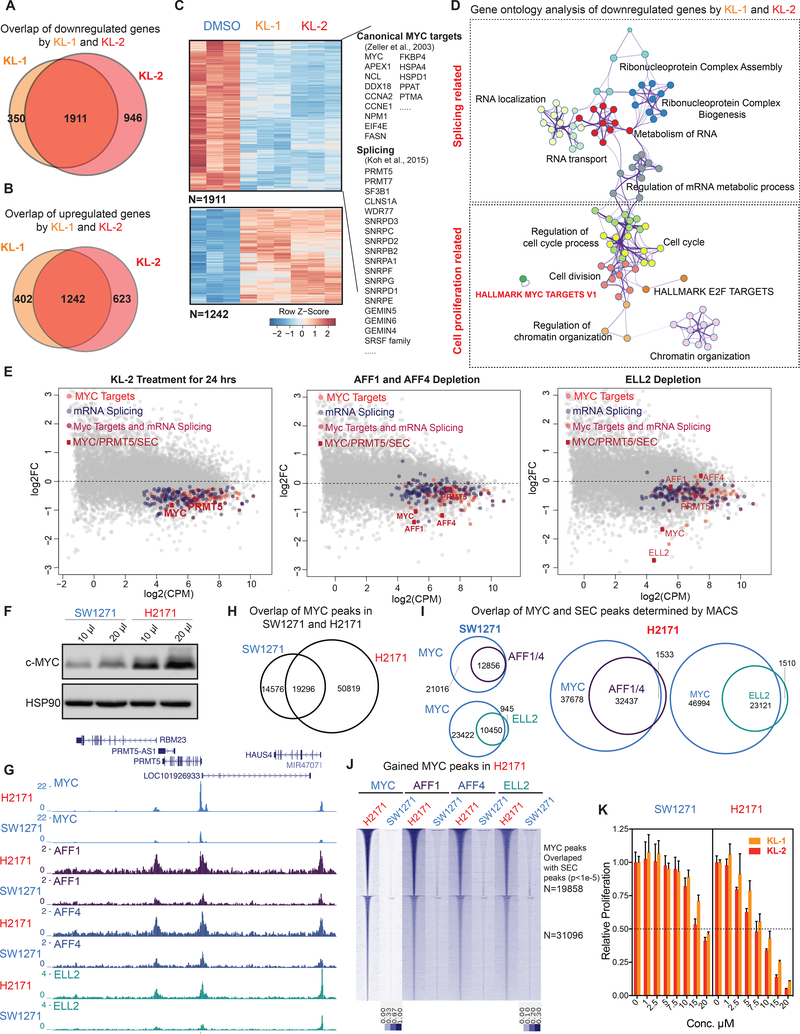
Figure 6. SEC disruption targets MYC and MYC target genes.
(A-B) Venn diagram of deregulated genes in 293T cells by KL-1 and KL-2. 1,911 genes were downregulated and 1,242 genes were upregulated by both inhibitors.
(C) Heatmap showing expression changes in response to SEC inhibitors, with differentially expressed canonical MYC targets, RNA splicing factors, and core SNRP assembly genes highlighted. Z score-normalized values are displayed (n=3).
(D) Network enrichment analysis with Metascape (Tripathi et al., 2015) of the 1,911 genes downregulated by both KL-1 and KL-2. Each cluster is represented by different colors and a circle node denotes an enriched term.
(E) MA plots of RNA splicing and Hallmark MYC target genes in KL-2 treated, AFF1 and AFF4 co-depletion, and ELL2-depleted cells. Circles mark downregulated splicing and Hallmark MYC target genes. The MYC and PRMT5 genes, and genes encoding SEC components are denoted as red squares.
(F) Western analysis of MYC levels in the MYC lowly expressed small cell lung cancer cell line SW2171 and MYC-amplified small cell lung cancer cell line H2171.
(G) Increased SEC at MYC binding sites in MYC highly expressed H2171 cells. Genome browser views of MYC and SEC occupancy around the PRMT5 gene in SW1271 and H2171 cells are shown.
(H) ChIP-seq analysis of MYC binding peaks in SW1271 and H2171 cells. Venn diagram of MYC peaks showing that H2171 cells gain more MYC binding sites.
(I) MYC and SEC overlap in SW1271 and H2171 cells. The SEC and MYC peaks were determined by MACS with a p-value cutoff at 1E-5.
(J) Heatmap of SEC occupancy at the 50,819 gained MYC binding sites in H2171 cells. The heatmap is separated based on whether gained SEC peaks could be called by MACS with a p-value cutoff of 1E-5.
(K) MYC-amplified H2171 cells are more sensitive to KL-1 and KL-2 inhibition than MYC lowly expressed SW2171 cells. Both cell lines were treated with increasing concentrations of KL-1 and KL-2 for 3 days and cell proliferation was measured with CellTiter-Glo (Promega) (n=3–6). See also Figure S6.

