
Figure 6.
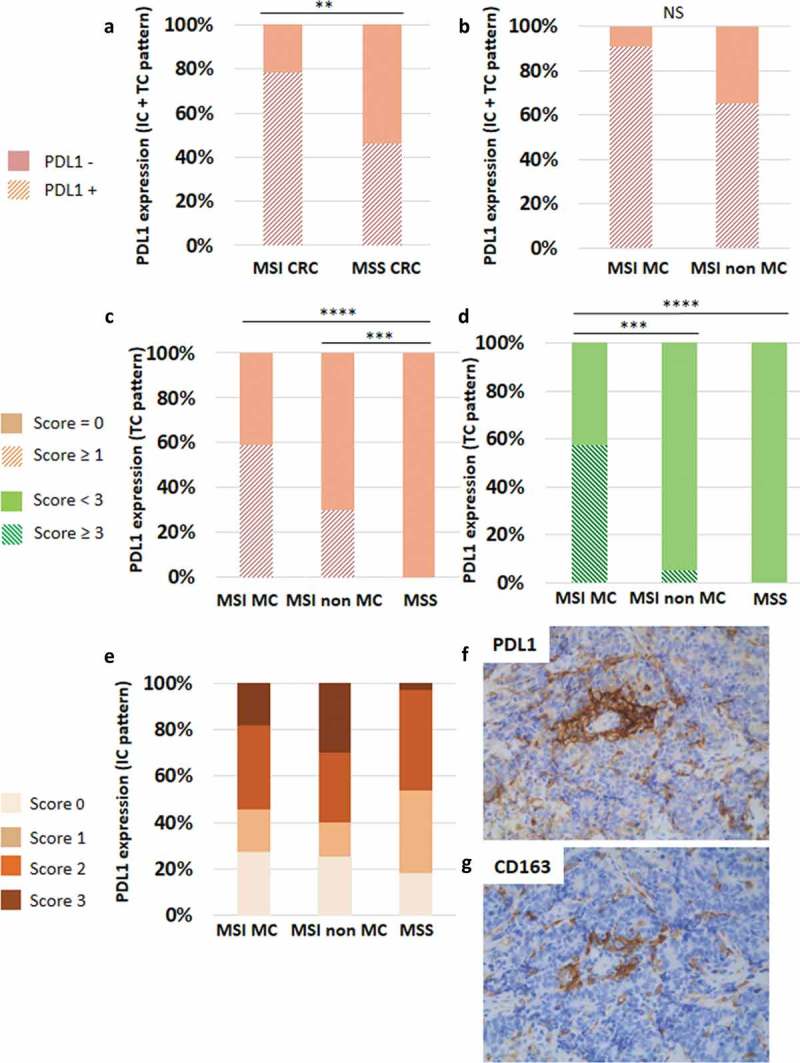
Heterogeneous expression profile of PDL1 in CRC. (a) PDL1 was preferentially expressed in MSI compared to MSS CRC. (b) Among MSI CRC, PDL1 expression was preferentially observed in the medullary subtype of CRC. Considering the expression of PDL1 by tumor cells (TC), only MSI CRC featured this expression pattern (c), especially the medullary subtype (d). PDL1 expression by immune cells (IC) was also heterogeneous. (e) Percentages of PDL1-positive IC among the three groups of CRC, depending on the scores (0 to 3). (f) A representative case of non-MC MSI CRC containing numerous PDL1-positive IC (score 3) surrounding PDL1-negative TC islets. (g) Most of PDL1-positive IC in close contact with TC are CD163+ M2 macrophages (x200 magnification). Asterisks indicate the statistical significance between subgroups of CRC (Mann–Whitney test; **p < 0.01; ***p ≤ 0.001; ****p < 0.0001).