Figure 8.

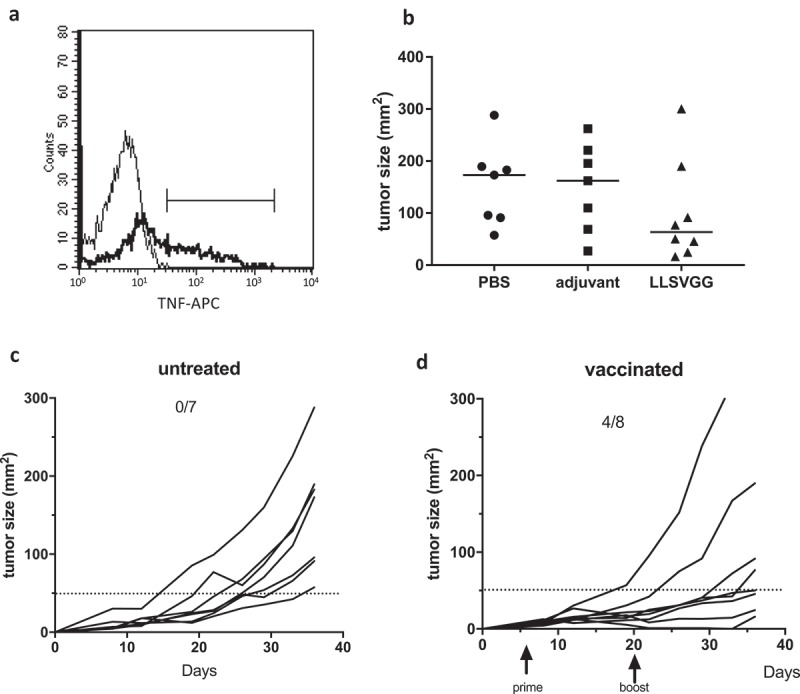
Panel A. Recognition of the SARC-A2 cell line transfected or not with MELOE-1 cDNA by a MELOE-136-44-specific HLA-A*0201-restricted CD8 T cell clone. TNFα production was assessed by intracellular staining following incubation of the clone with tumor cells for 5 h at a 1:1 ratio. Panel B. Comparison of tumor sizes at day 36 in the three groups of mice, vaccinated with PBS, or adjuvant alone or aSLP containing the LLSVGG linker. Bars indicate median of each group. Panel C and D. Monitoring of the growth of subcutaneous SARC-A2-MELOE-1 cells (2x10⁵ cells) in PBS-treated mice (panel C) or vaccinated mice (panel D). Prime vaccination and boost are indicated by arrows.
