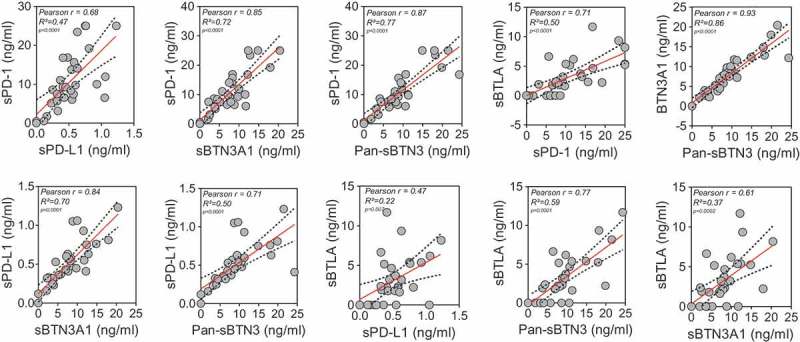
Figure 1.

Correlation between plasma sBTN3A levels (assessed with “pan-sBTN3A” ELISA or “sBTN3A1-specific” ELISA), sPD-1, sPD-L1 and sBTLA in PDAC patients (learning cohort, n = 32). Data are shown in ng/ml. According to the Gaussian distribution of data, the correlation was established using the parametric Pearson correlation coefficient (r).
