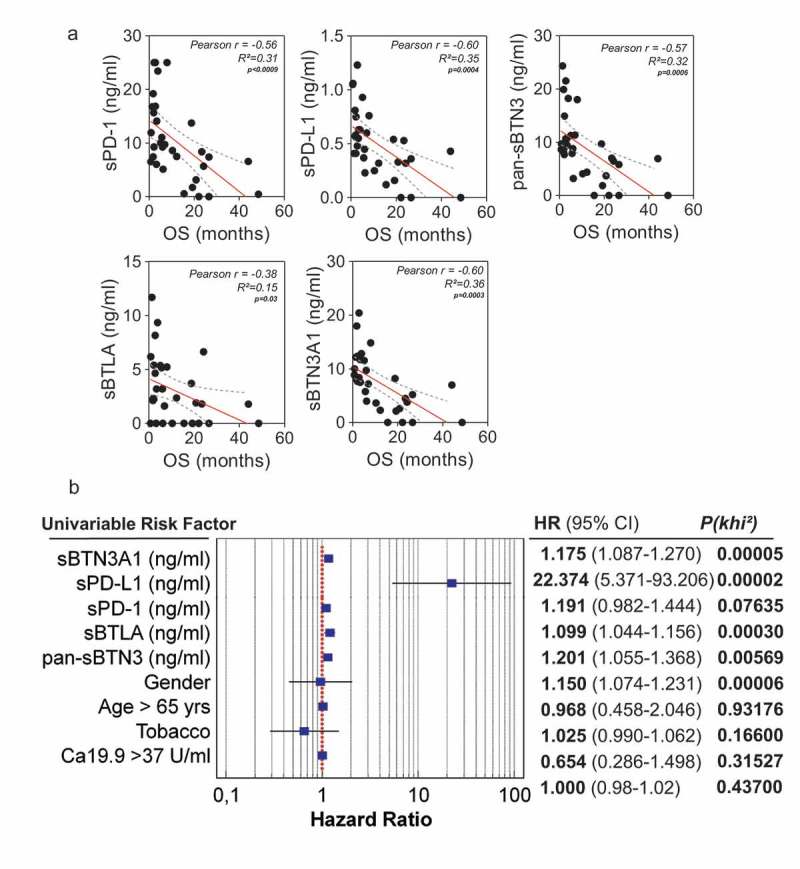
Figure 2.

Correlation between plasma levels of immune checkpoints (sPD-1, sPD-L1, sBTLA, sBTN3A1and pan-sBTN3A) and PDAC patient overall survival. In Figure 2A, a significant inverse correlation was found between sPD-1 (p < 1.10–4), sPD-L1 (p = 4.10–3), sBTN3A1 (p = 3.10–3), pan-sBTN3A (p = 6.10–4), sBTLA (p = 3.10–2) and patient overall survival (OS). The correlation was established using the parametric Pearson correlation coefficient (r). In Figure 2B, the prognostic relevance of each marker was assessed by a univariate survival analysis using the Cox regression model.
