
Figure 7.
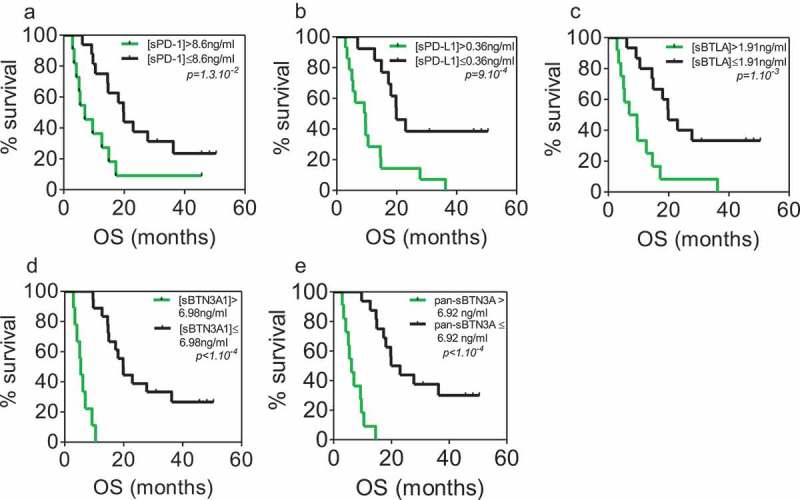
Kaplan–Meier analysis of overall survival in patients from validation cohort with plasma levels above and below the previously determined thresholds of sPD-1 (a), sPD-L1 (b), sBTLA (c), sBTN3A1 (d) and pan-sBTN3A (e).
Official websites use .gov
A
.gov website belongs to an official
government organization in the United States.
Secure .gov websites use HTTPS
A lock (
) or https:// means you've safely
connected to the .gov website. Share sensitive
information only on official, secure websites.
Kaplan–Meier analysis of overall survival in patients from validation cohort with plasma levels above and below the previously determined thresholds of sPD-1 (a), sPD-L1 (b), sBTLA (c), sBTN3A1 (d) and pan-sBTN3A (e).