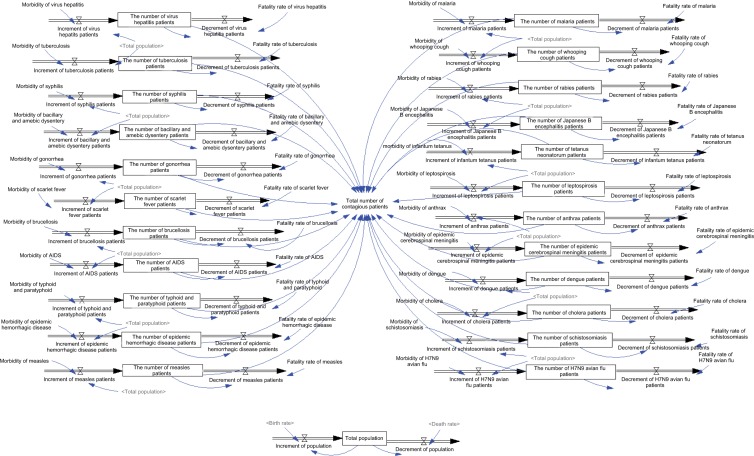
Figure 4.
Number of contagious patients in the disease control system.
Notes: Different shading of text tone in figure indicates model consists of several logically dedicated parts ie, subdiagrams. Each subdiagram containing a number of tightly interrelated variables. Lighter shading of text tone indicates variables used in several subdiagrams.

