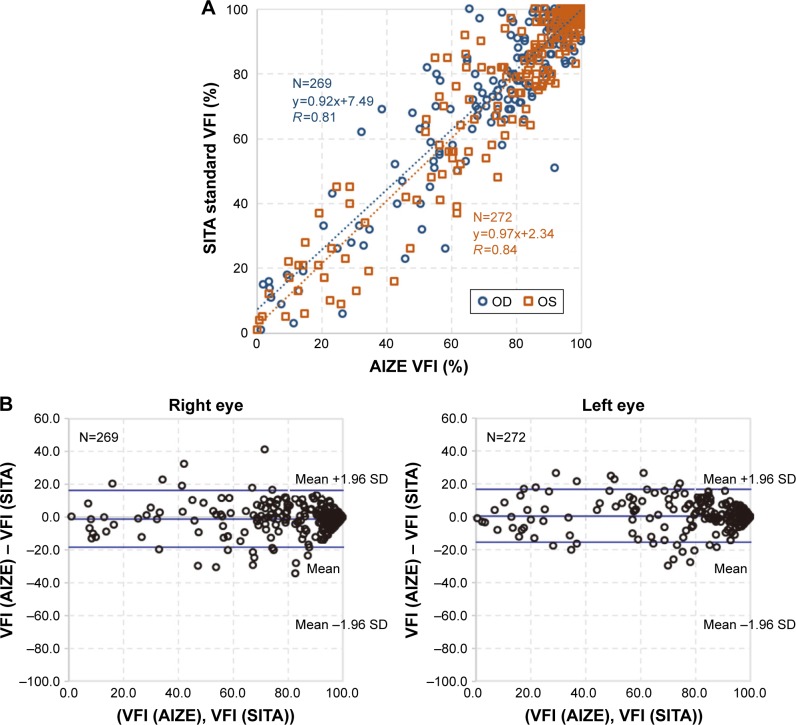
Figure 10.
VFI correlation between HFA and imo®.
Notes: (A) Correlation between HFA 30-2 vs imo 24plus (1-2). Blue dotted regression line (r=0.81, P<0.001): right eye slope, 95% CI (0.90–0.94); orange dotted regression line (r=0.84, P<0.001): left eye slope, 95% CI (0.95–0.99). (B) Bland–Altman plots: right eye mean value, 95% CI (−1.1, −18.4 to 16.2); left eye mean value, 95% CI (0.50, −15.6 to 16.7).
Abbreviations: HFA, Humphrey Field Analyzer; VFI, visual field index.

