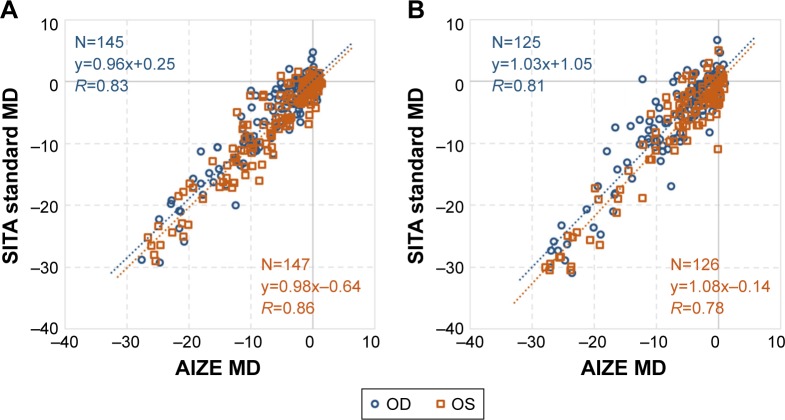
Figure 11.
MD correlation by imo® type.
Notes: (A) HFA vs i-H. Blue dotted regression line (r=0.83, P<0.001): right eye slope, 95% CI (0.92–1.00); orange dotted regression line (r=0.86, P<0.001): left eye slope, 95% CI (0.94–1.02). (B) HFA vs i-F. Blue dotted regression line (r=0.81, P<0.001): right eye slope, 95% CI (0.98–1.08); orange dotted regression line (r=0.78, P<0.001): left eye slope, 95% CI (1.04–1.12).
Abbreviations: HFA, Humphrey Field Analyzer; i-F, imo fixed type; i-H, imo head-mounted type; MD, mean deviation.

