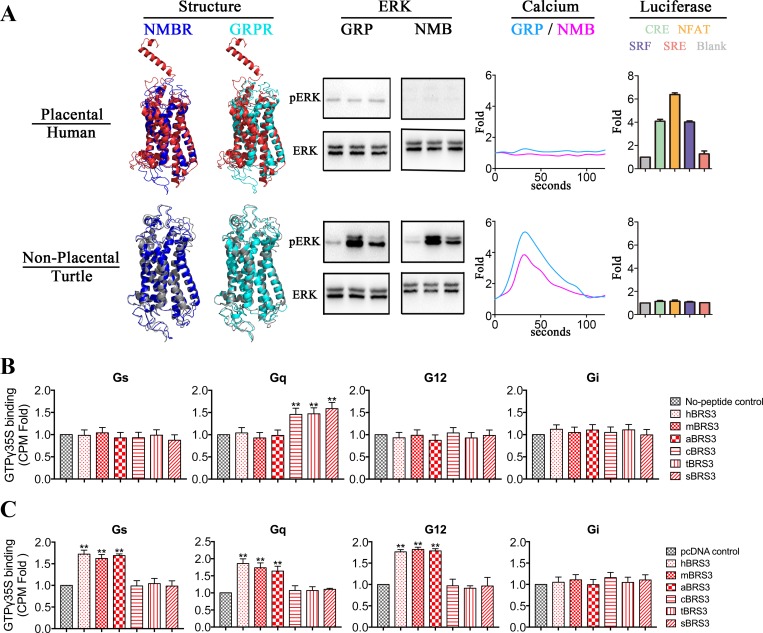
Fig 2. Representation of different protein structures and different function between nonplacental vertebrate BRS3 and placental mammalian BRS3.
(A) Two representative species are shown: human represents placental mammals, and turtle represents nonplacental vertebrates. Four structure comparisons were predicted as representation: red, gray, cyan, and blue represent placental mammalian BRS3, nonplacental vertebrate BRS3, NMBR, and GRPR, respectively. The ERK lane: the phosphorylation levels of ERK for each of BRS3 receptors. GRP and NMB peptides are utilized to activate BRS3 in placental mammals and nonplacental vertebrates, respectively. Three time points of 0, 2, and 5 min were chosen. The calcium lane: the levels of Ca2+ ions in cells for each of the BRS3 receptors. The calcium fold is calculated by fluorescence intensity (excitation/emission wavelength: 490/520 nm). The luciferase lane: constitutive activity for BRS3 in placental mammals but not in nonplacental vertebrates. The luciferase fold is calculated by luminescence intensity. (B) Nonplacental BRS3 coupled with Gq in a ligand-dependent manner with GTPgamma35S incorporation assay. The results represent mean ± SEM of raw data from three independent experiments performed in triplicates. (C) Placental mammalian BRS3 coupled with Gs, Gq, and G12 in a ligand-independent manner with GTPgamma35S incorporation assay. The underlying data can be found in S1 Data. aBRS3, aardvark BRS3; BRS3, bombesin receptor subtype-3; cBRS3, chicken BRS3; CPM, counts per minute; CRE, cAMP response element; ERK, extracellular signal–regulated kinase; GRP, gastrin-releasing peptide; GRPR, GRP receptor; hBRS3, human BRS3; mBRS3, mouse BRS3; NFAT, nuclear factor of activated T cells; NMB, neuromedin B; NMBR, NMB receptor; pERK, phosphorylated ERK; sBRS3, spotted gar BRS3; SRE, serum response element; SRF, serum response factor; tBRS3, turtle BRS3.

