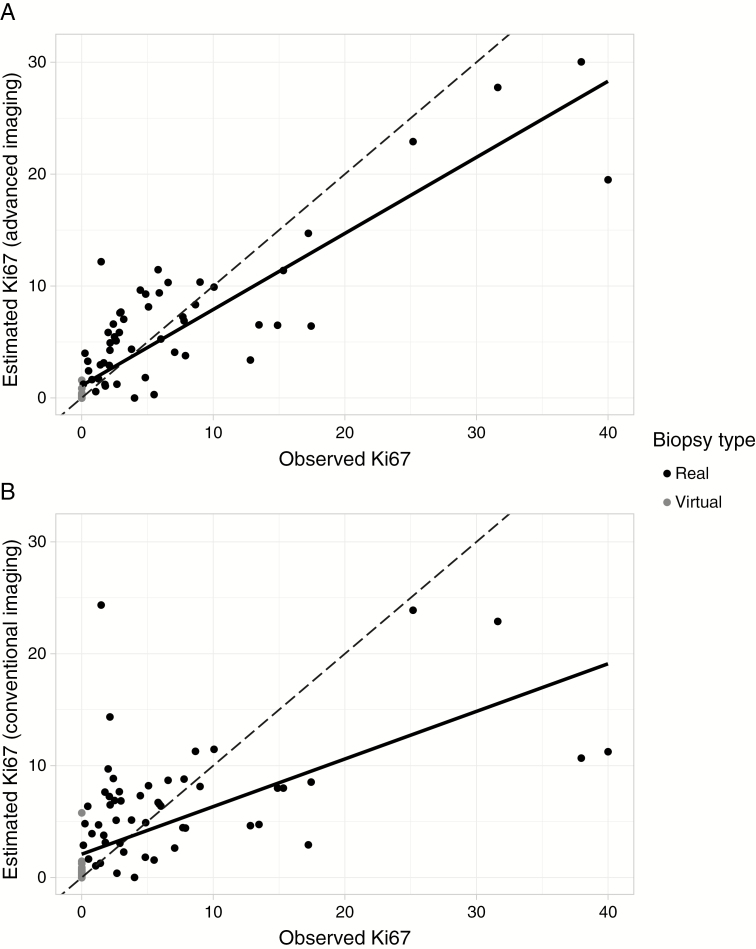
Fig. 2.
Model predictions. Plots show the observed Ki-67 at each biopsy location compared with predicted Ki-67 from a random forest using 5-fold cross validation. Each point represents a prediction made on a member of a fold not used for training during cross validation. The dashed lines indicate perfect agreement (predicted equals observed) and the solid line is a best-fit. In both plots the correlation between predicted and observed values is significant (P < 0.0001). (A) The final model using 4 imaging inputs (T2, FA, CBF, Ktrans) based on conventional plus advanced imaging gives good estimates of Ki-67 compared with the ground truth immunohistochemistry (best fit line: predicted = 0.680 * observed + 1.10, R2 = 0.771). (B) Using conventional imaging data, only the model performance decreases, as shown by the weakened correlation between predicted and observed values (best fit line: predicted = 0.426 * observed + 2.09, R2 = 0.397). There are also considerably more outliers using conventional imaging only. The R2 values for these plots are comparable to the average R2 values from cross validation listed in Table 3, which calculates the correlations between predicted and observed values for each fold separately and averages.

