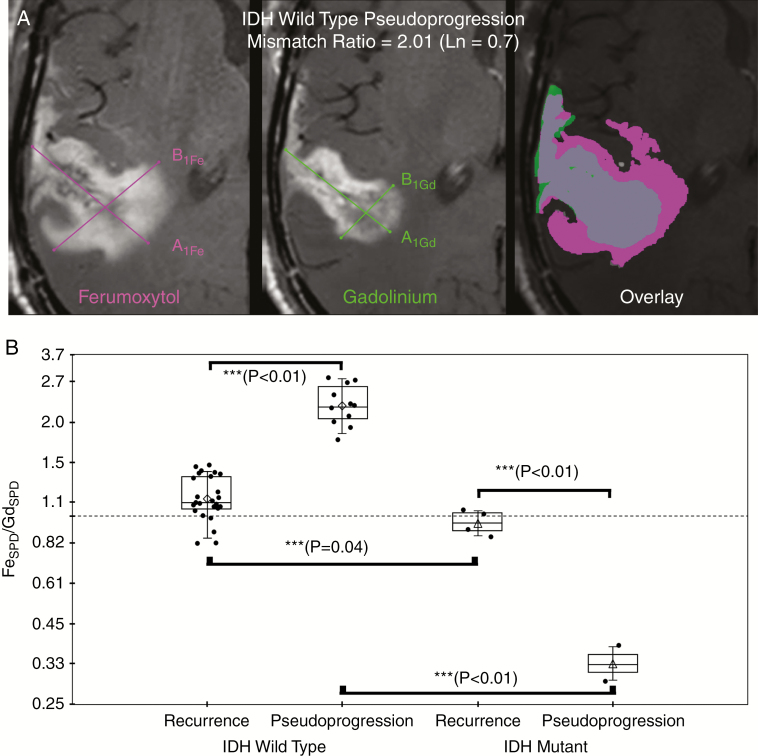
Fig. 2.
Representative example of ferumoxytol (Fe, left) and gadolinium (Gd, middle) SPD measurement (A) and graph of mean natural log ratio measurements (B) categorized by final disease status and IDH-1 mutational status. (A) Sum of products diameter (SPD) was calculated for 24-hour delayed ferumoxytol enhanced phase (left image) and gadolinium enhanced (middle image) T1-weighted images; SPD = A1 × B1 at maximal site of enhancement according to RANO guidelines. Contrast enhancement mismatch was calculated as the natural log ratio of SPDFe/SPDGd. For statistical analysis, the natural log of the enhancement mismatch ratio was used so that nonlinearities in ratio variables could be linearized such that the ratios are equidistant and the dependent variable is not weighted in favor of the denominator. For illustrative purposes; fused imaged overlay (ferumoxytol enhancing region, pink; gadolinium enhancing region, green; enhancing overlap, gray; right image) demonstrates the degree of ferumoxytol/gadolinium mismatch in an IDH-1 wild type patient with pseudoprogression. (B) Box plot of cohort enhancement mismatch values as the ratio categorized by final disease status (disease recurrence or pseudoprogression) and IDH-1 mutational status demonstrates contrast enhancement mismatch ratio was found to be significantly different at all posttherapy timepoints when assessed by ANOVA (***denotes statistical significance). Significantly elevated enhancement mismatch ratios were observed in patients with recurrent IDH-1 wild type glioblastoma compared with patients with recurrent IDH-1 mutated glioblastoma (0.13 ± 0.17 vs −0.05 ± 0.09, P = 0.04). Additionally, IDH-1 wild type pseudoprogression was significantly elevated compared with IDH-1 wild type recurrent disease (0.82 ± 0.15 vs 0.13 ± 0.17, P < 0.01).

