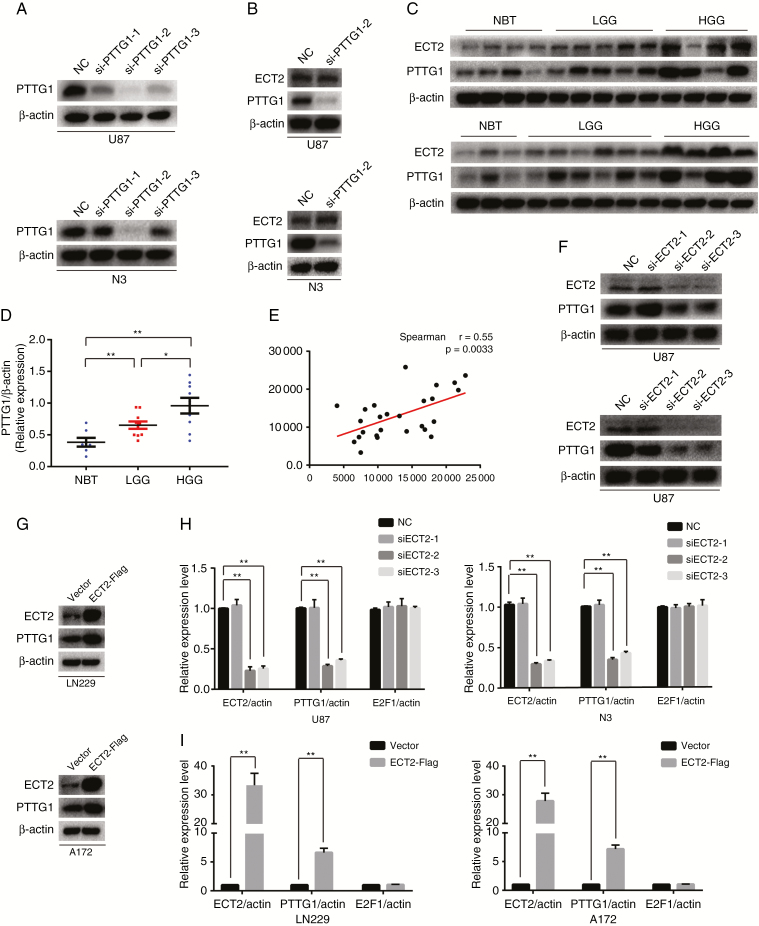
Fig. 2.
ECT2 promotes the expression of PTTG1. (A) Downregulation of PTTG1 in U87 and N3 cells was confirmed using western blot. (B) The protein level of ECT2 was unchanged after the downregulation of PTTG1 using western blot. (C, D) The expression of PTTG1 and ECT2 in clinical tissues was measured using western blot; β-actin served as a loading control. (E) Spearman correlation analysis of the relationship between ECT2 and PTTG1 in identical clinical tissues (r = 0.55, P = 0.0033). (F, G) Western blot was used to detect the changes in PTTG1 protein levels after interference or overexpression of ECT2 in glioma cells. (H, I) RT-PCR was used to detect the mRNA levels of PTTG1 and E2F1 after downregulation or upregulation of ECT2 in glioma cells. Data represent the mean ± SD (*P < 0.05, **P < 0.01).

