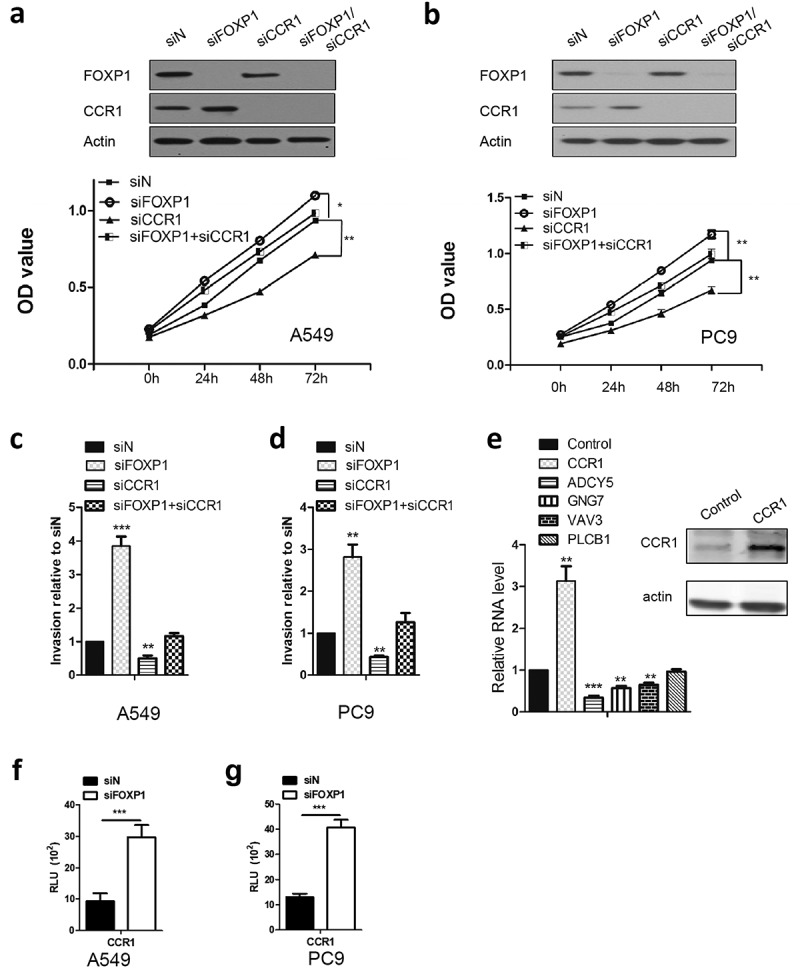
Figure 4.

CCR1 is required for FOXP1-mediated effect.
(a and b) OD values of A549 (a) and PC9 (b) cells at 24h, 48h, and 72h after siFOXP1, siCCR1, or siFOXP1+ siCCR1 treatment. Upper panels are Western blot images showing the FOXP1 and CCR1 expression 48 hrs after the treatment of different siRNAs. Actin serves as loading control. (c and d) Bar graphs show the relative invasion of A549 (c) and PC9 (d) cells 48 hrs after siFOXP1, siCCR1, or siFOXP1+ siCCR1 treatment. (e) RT-PCR shows the expression levels of ADCY5, GNG7 and VAV3 but not PLCB1 48 hrs after the overexpression of CCR1. Inset is the gel picture of Western blot examining the expression of CCR1 in overexpressed cells. (f and g) Bar graphs show the luciferase activity in A549 (f) and PC9 (g) cells after 36 hrs of FOXP1 siRNA treatment. * p < 0.05, ** p < 0.01, *** p < 0.001.
