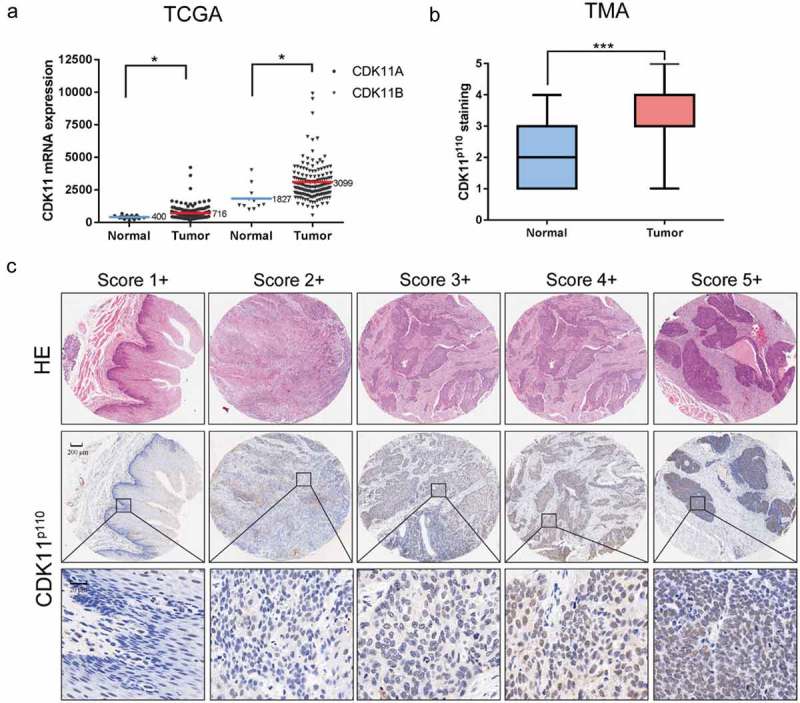
Figure 1.

Analysis of CDK11 expression in human esophageal cancer via TCGA database and tissue microarray analysis. (a) Expression of CDK11A and CDK11B in normal tissue (n = 11) and esophageal cancer tissue (n = 162) from TCGA datasets. *P < 0.05, showing a significant difference. (b) Distribution of CDK11p110 staining scores among ESCC tissues and their adjacent normal tissues in tissue microarray (TMA) analysis. Statistical analysis was performed with the Mann-Whitney U test. ***P < 0.001, showing a significant difference. CDK11p110 expression was classified into categories 1–5 according to the CDK11p110 staining intensity and percentage values, as described in the Materials and Methods section. (c) Representative images showing the different CDK11p110 protein immunohistochemical staining categories in ESCC and adjacent normal tissues on TMA sections. The HE staining was performed by Shanghai Outdo Biotech Co., Ltd. (Shanghai, China) and was used to show the tumor area.
