
Figure 1.
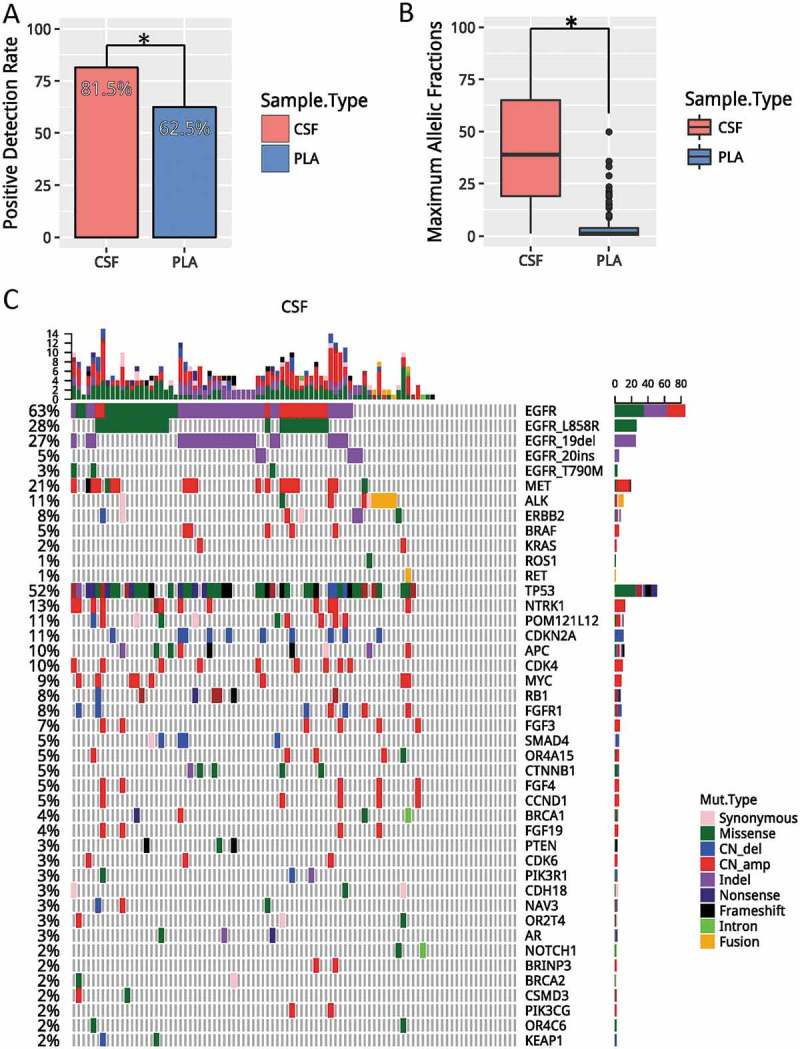
CSF is superior to plasma in reflecting LM. A). Detection rates, defined as having any mutation detected from the panel, in CSF (red) and plasma (blue). (B) Average maximum allelic fractions in CSF and plasma. (C) Oncoprint of CSF. Each column represents a patient; each row represents a gene. Different types of mutations were denoted in different colors. The total number of mutations a patient has is summarized by the top bar. The frequency of a mutation in this cohort is summarized by the side bar. * denotes p values< 0.05. CSF, cerebrospinal fluid; PLA, plasma; CNVs, copy number variations.