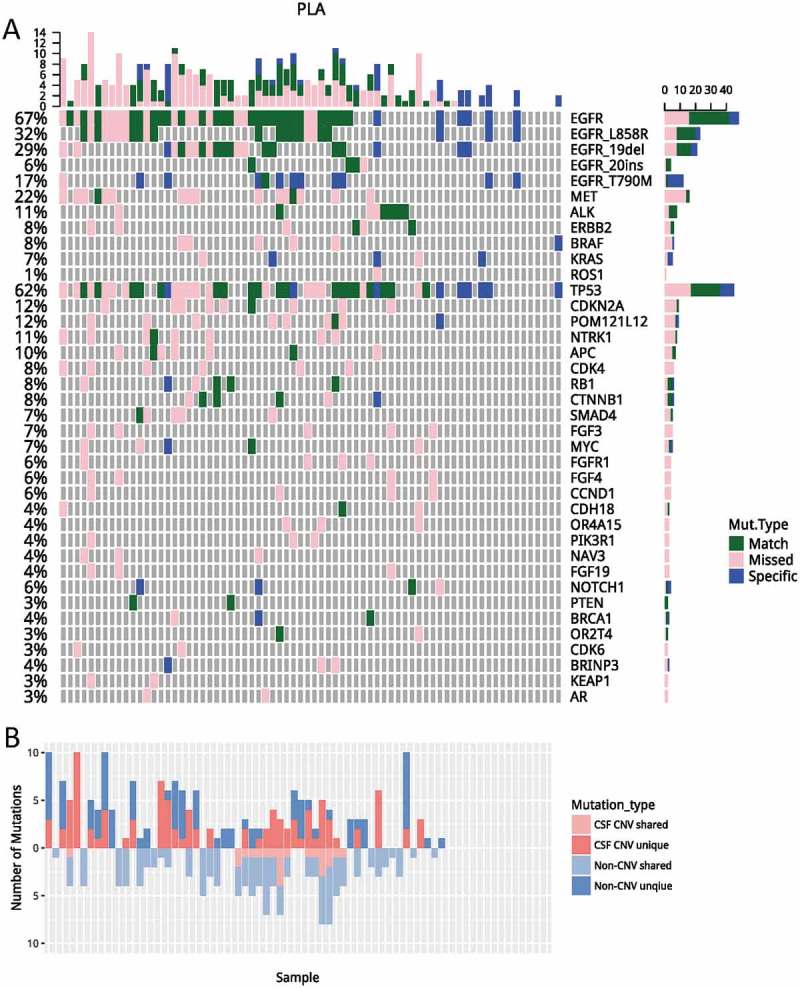
Figure 2.

A comparisons of genomic profiles obtained from CSF and plasma. (A) Using genomic profile obtained from CSF as a reference, mutations identified in CSF only were denoted in pink; mutations only identified in plasma were denoted in blue. Mutations identified from both media were denoted in green. (B) Unique/shared CNVs and non-CNVs were plotted. Mutations unique to CSF were plotted on top; mutations shared by CSF and plasma were plotted on the bottom. Dark and light red denote CNV; dark and light blue denote non-CNVs. PLA, plasma; CSF, cerebrospinal fluid; CNVs, copy number variations.
