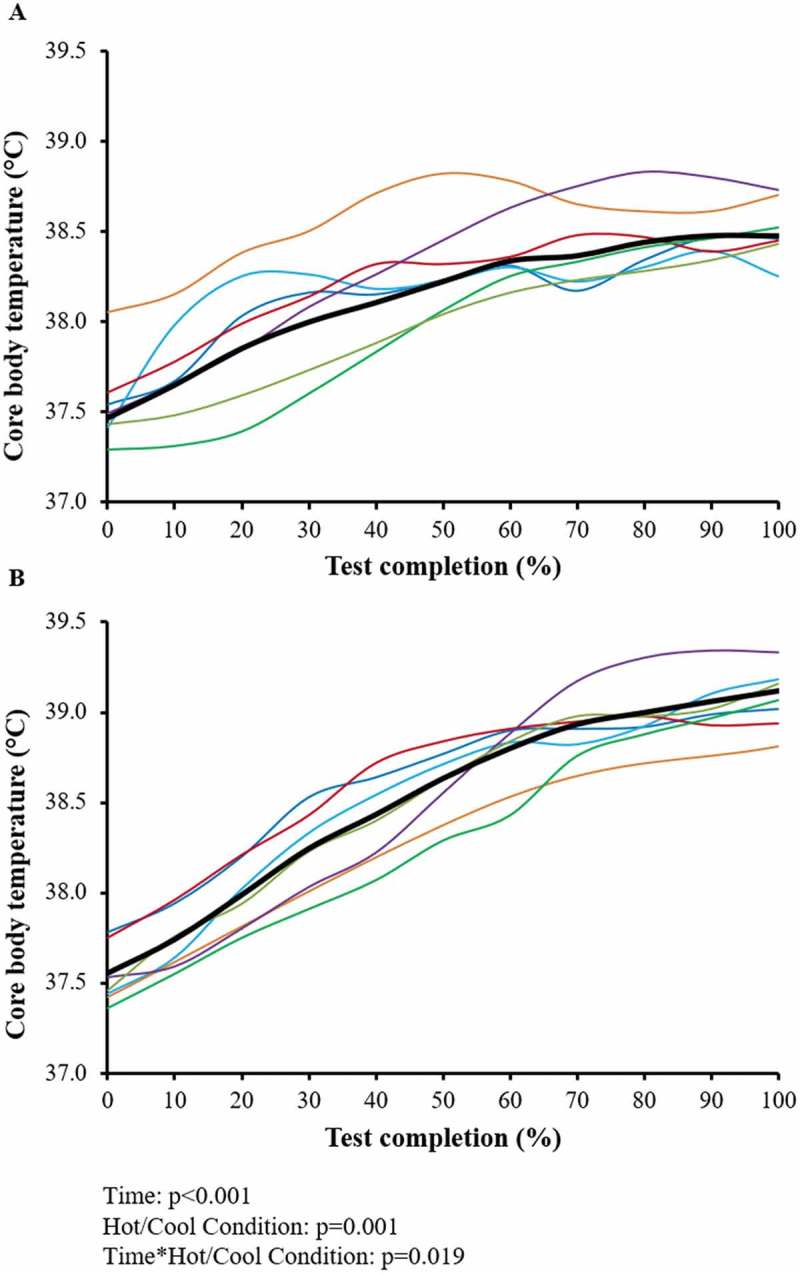
Figure 2.

Core body temperature during the class-specific test in the cool environment (a) and hot environment (b) for all seven athletes. The black bolded line represents the average TC over time. Each coloured line represents an athlete, as follows:  Laser – Women,
  Laser – Men,
  470 Crew – Women,
  470 Helm – Women,
  Finn – Men,
  RS:X – Women,
  RS:X – Men.
