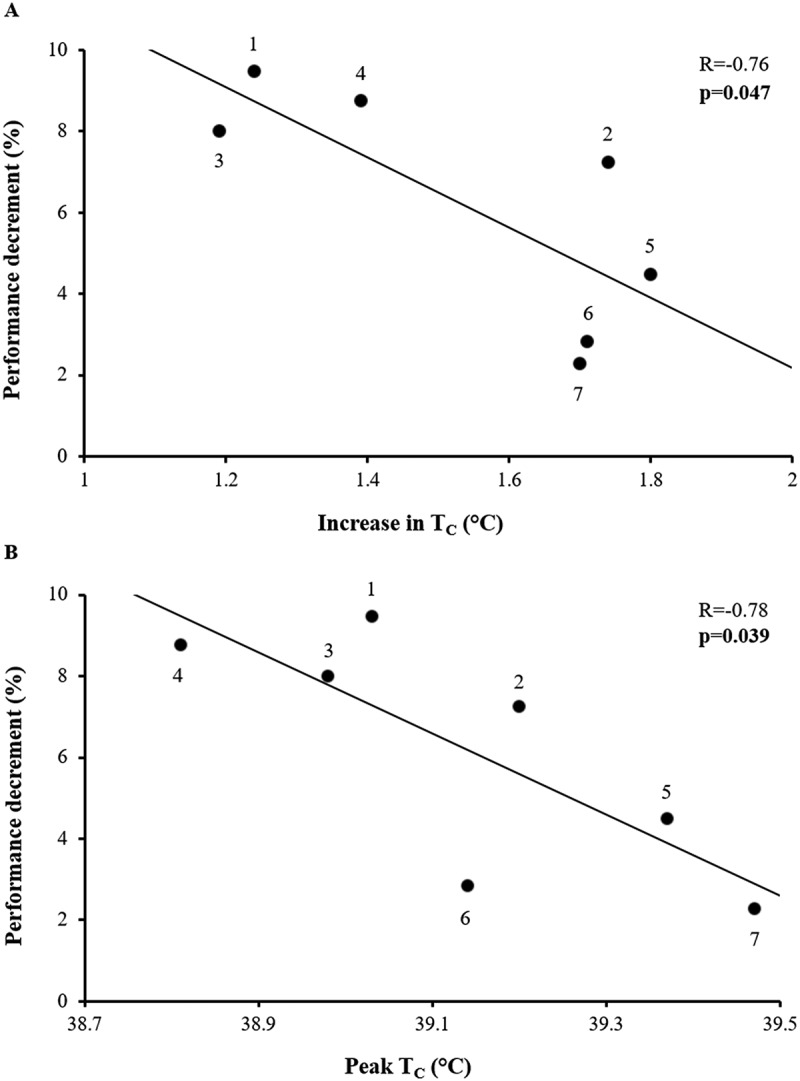
Figure 3.

Correlations between decrement in performance (%), and increase in core body temperature (a) and maximal TC (b) in the hot environment. Pearson correlation coefficient with significance level at p < 0.05. Each bullet represents an athlete, as follows: 1) Laser – Women, 2) Laser – Men, 3) 470 Crew – Women, 4) 470 Helm – Women, 5) Finn – Men, 6) RS:X – Women, 7) RS:X – Men.
