Figure 1.

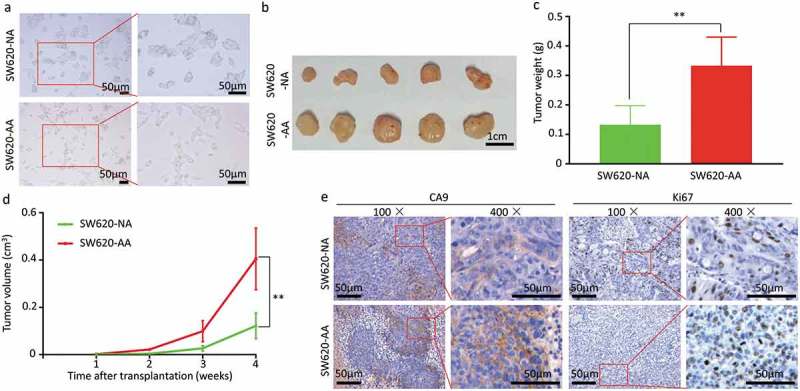
Enhanced growth of acid-adapted SW620 cells in vivo (a) The morphology of SW620-NA and SW620-AA cells. (b) The images of subcutaneous xenografts originated from SW620-NA and SW620-AA cells. (c) Comparison of tumor weight between SW620-NA and SW620-AA group using student’s t-test. (d) Tumor growth curves of SW620-NA and SW620-AA group. (e) Representative images showing immunohistochemical staining of Ki67 and CA9 in xenografts. Scale bar: 50μm if not indicated. *, <0.05; **,<0.01.
