. 2019 Mar 12;8:e44771. doi: 10.7554/eLife.44771

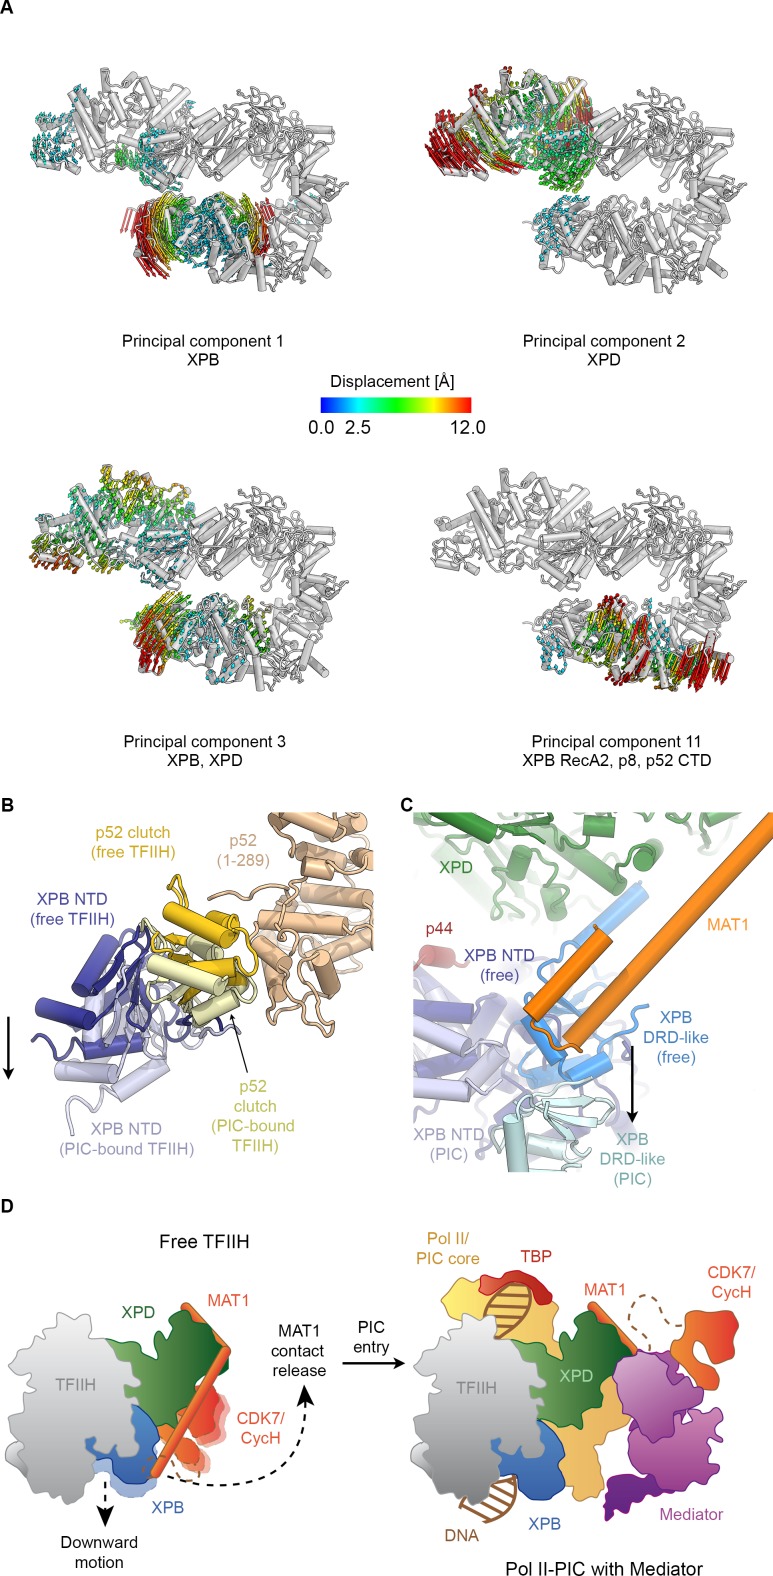
Figure 4. Conformational dynamics of TFIIH.

(A) Results of multibody analysis (also see Figure 4—figure supplement 1 and Materials and methods for details). Several major modes of motion (Cα displacement indicated by colored arrows; distances < 2.5 Å are not shown) involve the enzymatic subunits of the TFIIH core complex or their domains. (B) Motion of the p52 clutch domain (closed conformation gold, open conformation light yellow) and associated XPB NTD (closed conformation blue, open conformation light blue) relative to the remainder of p52 (brown), based on comparison of free and PIC-bound TFIIH structures and fitting of domains into Pol II-PIC cryo-EM maps (He et al., 2016; Schilbach et al., 2017). (C) XPB motions from the closed conformation (free TFIIH; darker blue hues) and the open conformation (TFIIH-PIC; lighter hues). The MAT1-XPB contact probably dissociates during this rearrangement. (D) Schematic model for the conformational transitions in MAT1 and repositioning of the CAK kinase module during Pol II-PIC entry of TFIIH.

Figure 4.

Figure 4—figure supplement 1. Analysis of conformational variance of TFIIH.
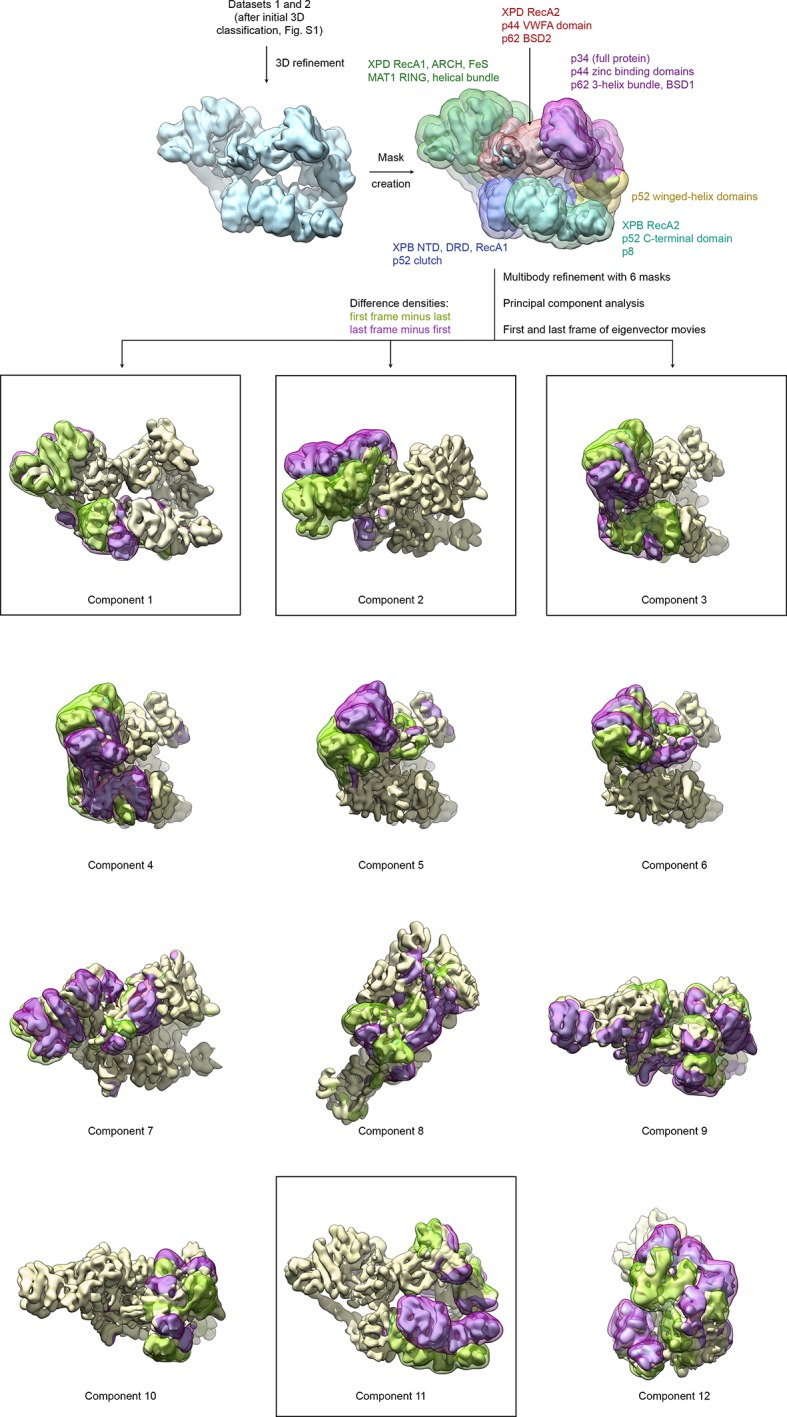
Figure 4—figure supplement 1.

VPP datasets 1 and 2 were refined and subjected to multibody refinement using six masks followed by principal component analysis. The first and last frames of the resulting eigenvector movies of the first 12 principal components are shown (both volumes are shown in light yellow), along with difference densities obtained by subtracting the last volume from the first (green) and vice versa (purple) to visualize the conformational differences in the eigenvector movie. For the boxed components, the full (non-subtracted) TFIIH particles with the highest and lowest eigenvalues were extracted and refined, and atomic coordinates were rigid body refined into the resulting maps (see Figure 4A and Materials and methods).
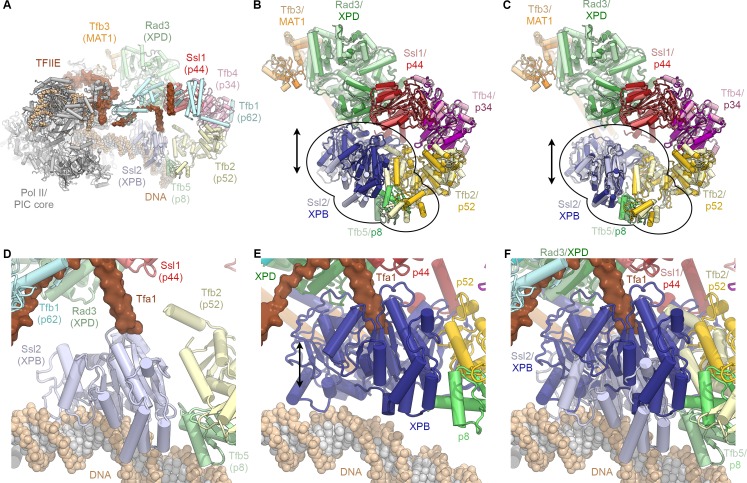
Figure 4—figure supplement 2. Conformational dynamics of TFIIH and comparison with the PIC-bound TFIIH.

Figure 4—figure supplement 2.

(A) Rendering of the yeast TFIIH-containing Pol II-PIC (Schilbach et al., 2017). TFIIH subunits are colored and labeled with their yeast names, with human names in brackets. (B) Superposition of TFIIH from the yeast PIC (as shown in A, light colors) (Schilbach et al., 2017) and the complete structure of the human TFIIH core complex (this work; superposed on p44, bright colors) as single bodies. The top lobe of TFIIH (MAT1 helical bundle, XPB, p44, p34, p52 winged-helix domains; p62 not shown for clarity) aligns well, while the XPB-p52 (clutch/C-terminal domain)-p8 module is in a different position for the free and PIC-bound TFIIH (indicated). (C) Same as (B), but with the human XPB-p52 (clutch/C-terminal domain)-p8 module superposed on the yeast structure as a rigid body. (D) View of DNA-bound Ssl2 (XPB) and neighboring subunits in the yeast Pol II-PIC (Schilbach et al., 2017). (E) View of human XPB, superposed on the yeast structure as in (B). XPB could not bind DNA in this conformation, and the Tfa1 (TFIIE α-subunit) bridge helix, as observed in the yeast Pol II-PIC, clashes with XPB. (F) Panels (D) and (E) combined, visualizing the conformational change of TFIIH upon entry into the Pol II-PIC.