Figure 1.

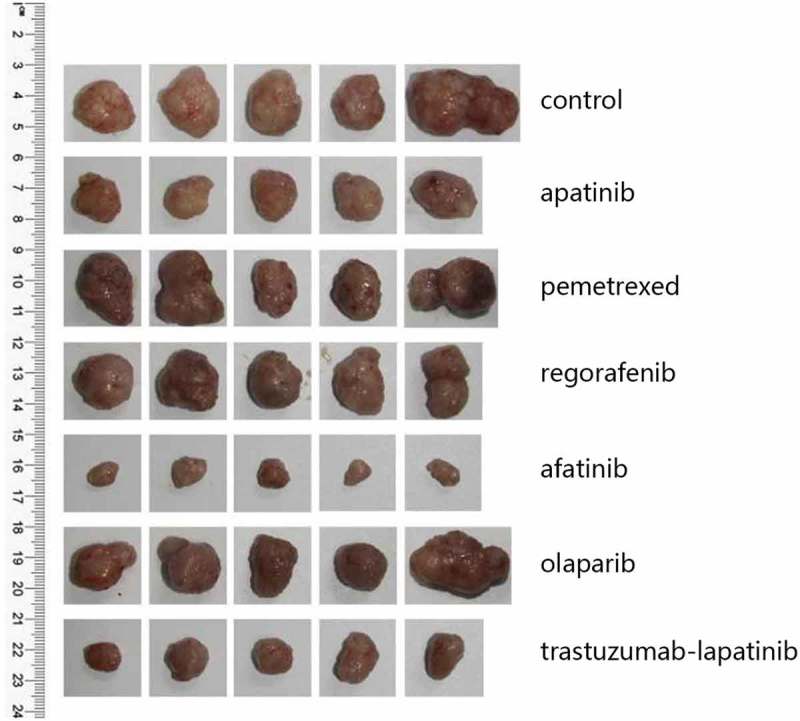
The PDX models from top to bottom are tumors of the control group and 6 drug sensitivity test groups (n = 5 per group), which were removed 30 days after modeling.

The PDX models from top to bottom are tumors of the control group and 6 drug sensitivity test groups (n = 5 per group), which were removed 30 days after modeling.