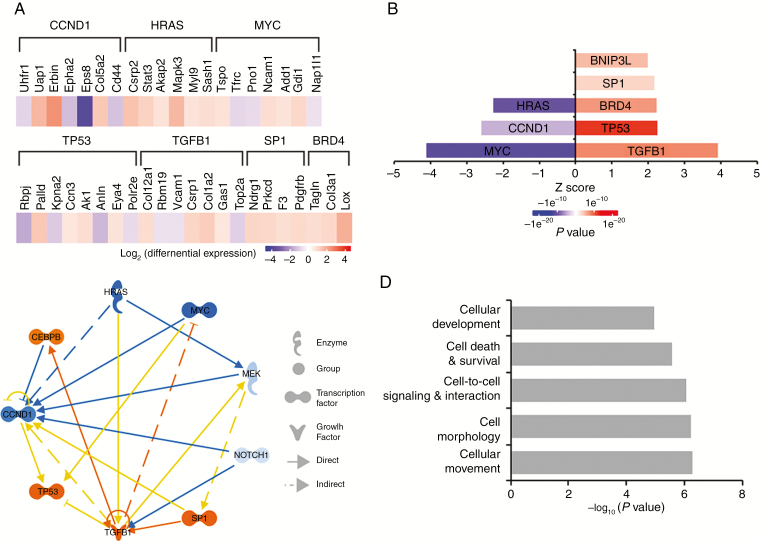
Fig. 3.
Trametinib reduces signaling through Ras, Myc, and cyclin D1, and increases signaling through TP53 and TGFβ1. (A) Proteomic heat map showing differences in protein abundance in trametinib- versus DMSO-treated cells as determined by LC-MS/MS (blue: decreased expression, red: increased expression). (B) Predictions of upstream signaling pathways modulated by trametinib treatment. (C) Focus molecules and their connectivity based on Ingenuity Pathway Analysis of differentially expressed proteins in trametinib-treated versus DMSO-treated MD-MSC. (D) Differentially expressed proteins function in the indicated cellular processes (n = 5 replicate experiments).

