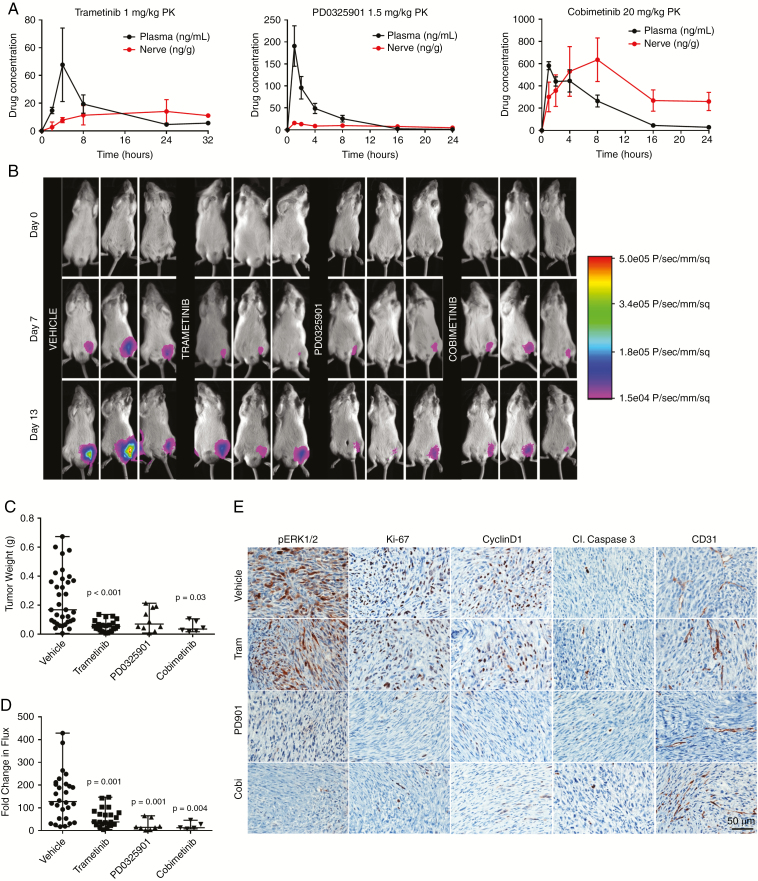
Fig. 4.
MEK inhibitors slow MD-MSC growth in NSG mice. (A) Pharmacokinetic analysis for plasma and nerve following a single drug dose. (B) Representative bioluminescent (BL) images for indicated times. (C) Median tumor weights after 14 days of drug treatment compared with vehicle (n = 6–35 mice, nonparametric ANOVA). (D) BL signals were normalized to day 0 for each mouse and fold change in flux (photons/sec) after 14 days of treatment is shown (nonparametric ANOVA, median values shown). (E) Representative graft immunohistochemistry images for pERK1/2, Ki-67, cyclin D1, cleaved caspase 3, and CD31.

