
Figure 6.
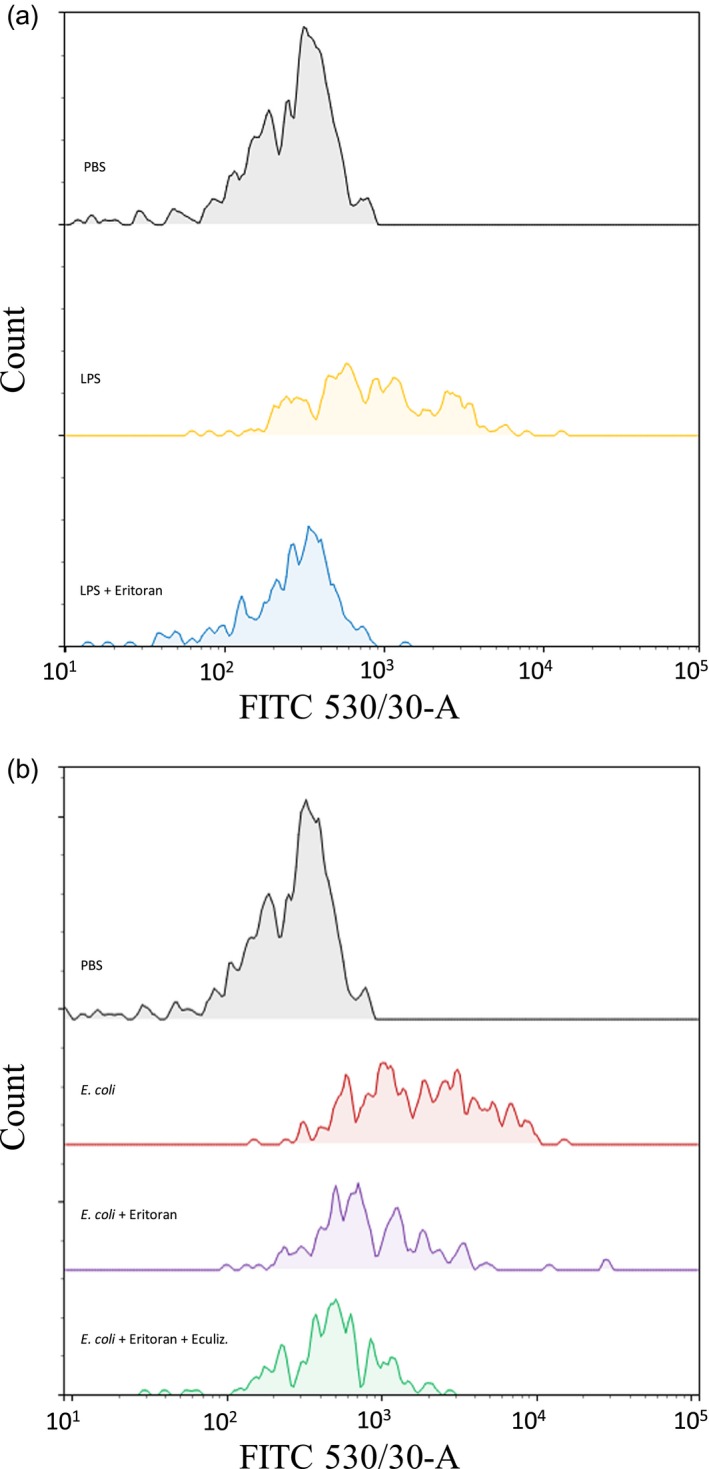
Representative histograms from the flow cytometric analysis of the monocyte tissue factor (TF) surface expression in blood from one of six healthy blood donors. The median fluorescence (MFI) signal derived from the fluorescein isothiocyanate (FITC)‐labeled anti‐TF antibody is depicted at the x‐axis and the monocyte count at the y‐axis. The isotype control antibody data were nearly identical for all samples and not included in this illustration. (a) Whole blood was incubated for 120 min at 37°C with phosphate‐buffered saline (PBS) (gray) or ultrapure E. coli lipopolysaccharide (LPS) (100 ng/ml) in the absence (yellow) or presence of eritoran (blue). (b) Whole blood was incubated for 120 min with PBS (gray) or E. coli (1 × 10⁷/ml) in the absence (red) or presence of eritoran (purple) or a combination of eritoran and eculizumab (Eculiz.) (green).