
Figure 5.
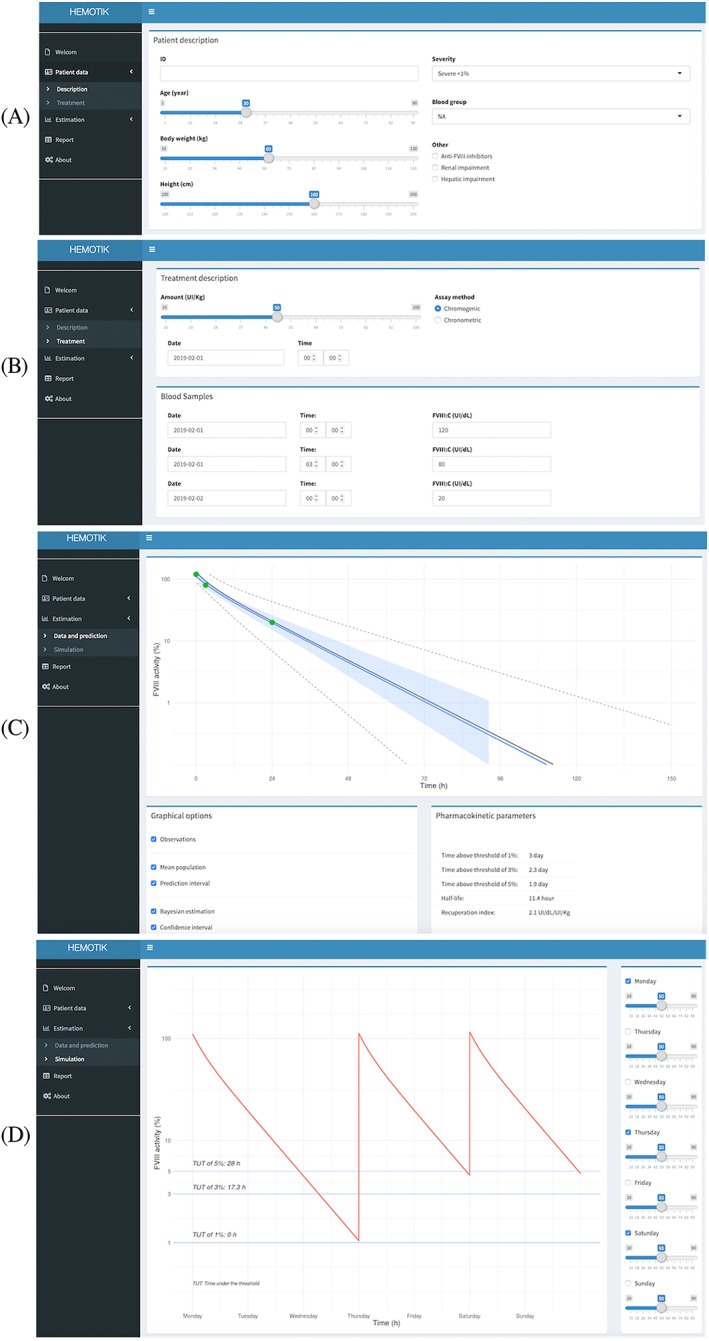
Using the Hemotik tool: (A) patient details, (B) treatment details, (C) pharmacokinetic estimation, (D) dosing simulation. The light grey shaded envelope represents the 90% confidence interval for the simulations. The grey shaded envelope represents the 50% interval for the simulation. The lines represent the median for different typical patients.