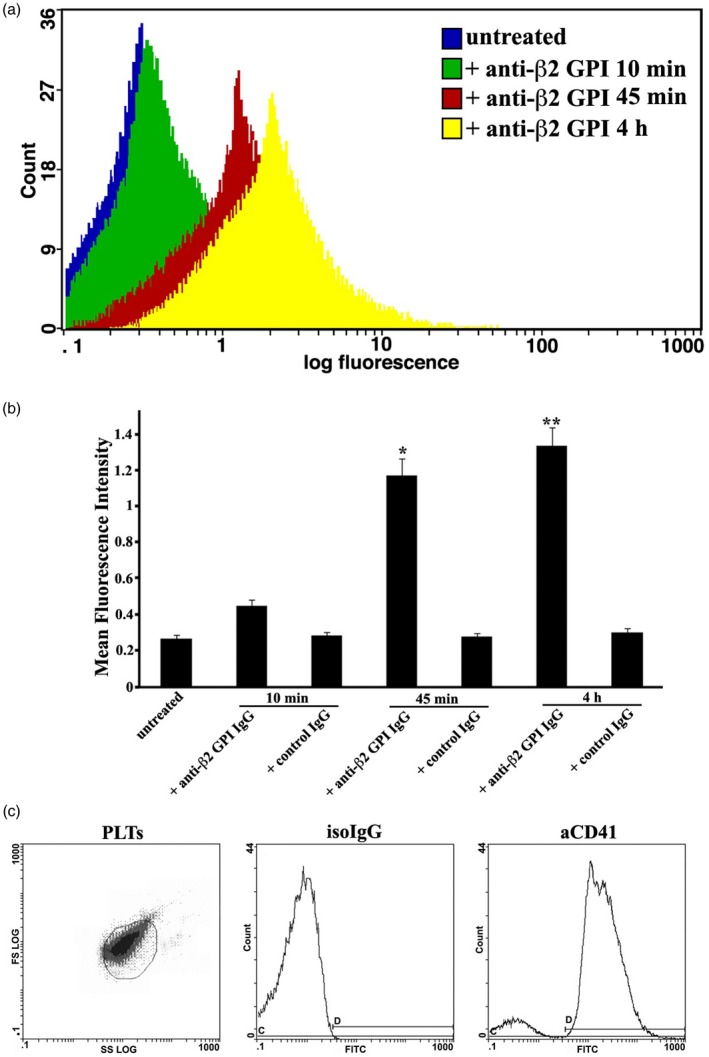
Figure 2.

Cytofluorimetric analysis of tissue factor (TF) expression on platelets. (a) Human platelets, untreated or treated with control immunoglobulin IgG, or with anti‐β2‐ glycoprotein I (GPI) IgG for 10 min, 45 min and 4 h, were stained with fluorescein isothiocyanate (FITC)‐conjugated anti‐TF monoclonal antibody (mAb) and analyzed by cytofluorimetric analysis. Platelets were gated on the basis of forward‐ (FSC) and side‐scatter (SSC) parameters. Histograms show the log fluorescence versus the cell number. Cell number is indicated on the y‐axis and fluorescence intensity is represented in three logarithmic units on the x‐axis. Fluorescence intensity was analyzed with a Coulter Epics Beckman cytometer. (b) Results represent the mean ± standard deviation (s.d.) from three independent experiments. *P + anti‐β2‐GPI IgG (45 min) <0·001 versus untreated. **P + anti‐β2‐GPI IgG (4 h) <0·001 versus untreated. (c) Purity of platelets (PLTs) was checked by flow cytometry using fluorescein isothiocyanate (FITC)‐conjugated anti‐CD41 IgG (aCD41) and FITC‐conjugated IgG as isotypic control (isoIgG).
