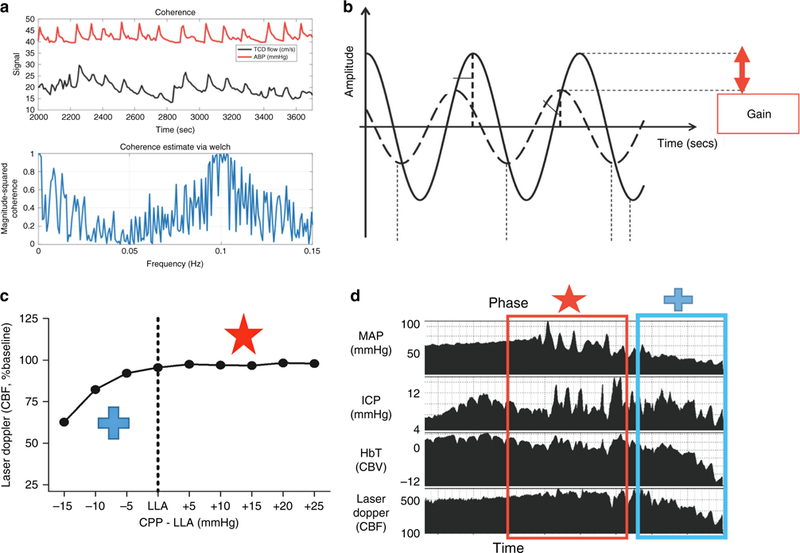
Fig. 3.

Graphical explanations of the autoregulation metrics. a Coherence analysis of CBF measured by transcranial Doppler (TCD) ultrasound in preterm neonate. Coherence is high between ABP (red line) and CBF (black line), indicating a state of dysautoregulation at slow wave frequencies. Bottom panel shows coherence as a function of frequency. b Waveform 1 (W1, solid line) and waveform 2 (W2, dotted line) are shown for concept. The gain is the damping effect and the phase shift is the time delay between the two waveforms. Lower gain indicates better autoregulatory function. c, d Blood pressure was decreased in a neonatal piglet with continuous mean arterial blood pressure (MAP), intracranial pressure (ICP), cerebral blood volume (CBV) NIRS tissue hemoglobin index, and cerebral blood flow (CBF) laser Doppler flow (LDF) measurements. When MAP exceeds the lower limit of autoregulation and CBF is relatively constant, slow MAP waves are out of phase with the ICP and CBV (red star and box). As MAP decreases below the lower limit of autoregulation and CBF falls, the MAP, ICP, and CBV waves are all in phase, indicating a state of dysautoregulation (blue cross and box). Adapted with permission from: SAGE Publications et al111, American Physiological Society et al112,, and Wolters Kuwer et al113
