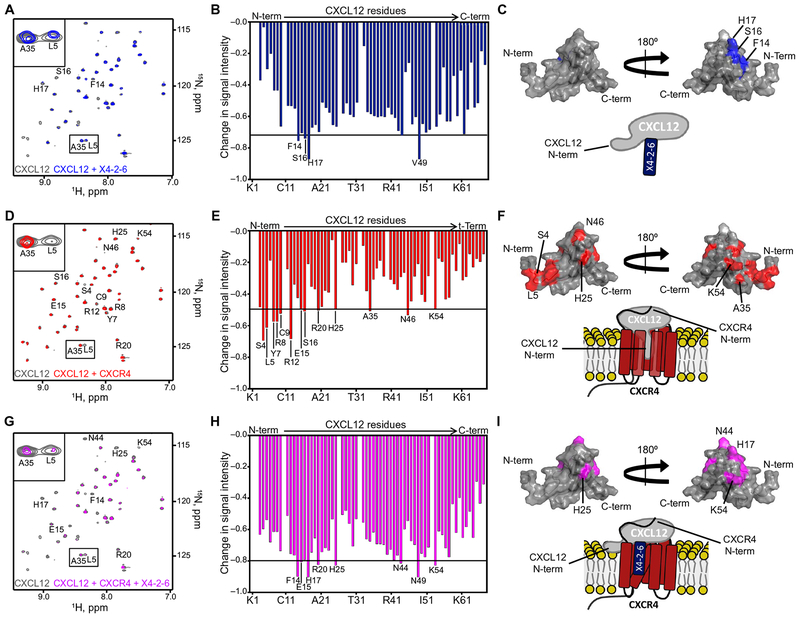
Fig. 4. X4-2-6 forms a ternary complex with CXCL12 and CXCR4 to function as a biased antagonist.
(A to C) NMR spectroscopy analysis of CXCL12 alone (gray) and in the presence of X4-2-6 (blue). Peak superimposition (A) and changes in CXCL12 HSQC signal intensity caused by the addition of X4-2-6 (B) are representative of two independent experiments. ppm, parts per million. (C) Substantially altered residues are mapped onto the NMR structure of CXCL12 (Protein Data Bank ID: 2KEE), and the cartoon models the interaction between the N-loop of CXCL12 and X4-2-6. (D to F) NMR spectroscopy analysis of CXCL12 alone (gray) and with membrane preparations containing CXCR4 (red). Peak superimposition (D) and changes in the signal intensity of CXCL12 residues caused by the addition of CXCR4 (E) are representative of two independent experiments. (F) Substantially altered residues are mapped onto the structure of CXCL12, and the cartoon models the interaction involving insertion of the N terminus of the chemokine into the receptor transmembrane helical bundle. (G to I) NMR spectroscopy analysis of CXCL12 alone (gray) and with CXCR4-containing membranes and X4-2-6 (magenta). Peak superimposition (G) and changes in CXCL12 signal intensity caused by the addition of CXCR4 and X4-2-6(H) are representative of two independent experiments. (I) The most substantial changes are mapped onto the NMR structure of CXCL12, and the cartoon models X4-2-6 binding to CXCR4 and CXCL12 to partially inhibit the binding of the extreme N terminus of the chemokine to the receptor.

