Figure 3.
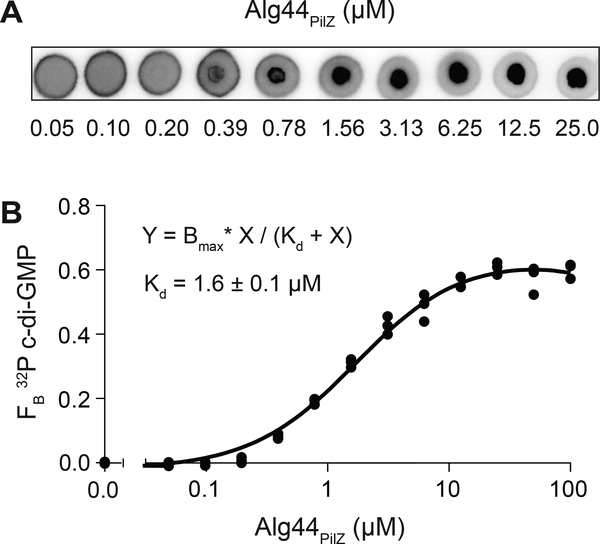
Determination of dissociation constant (Kd) by DRaCALA.
(A) Representative DRaCALA images of 32P-c-di-GMP interaction with indicated concentration of His-MBP-Alg44PilZ (μM). (B) FB calculated from (A) were plotted as a function of His-MBP-Alg44PilZ concentration. The best-fit line was determined by nonlinear regression using the indicated equation. Adapted with permission from Roelofs et al. (2011).

