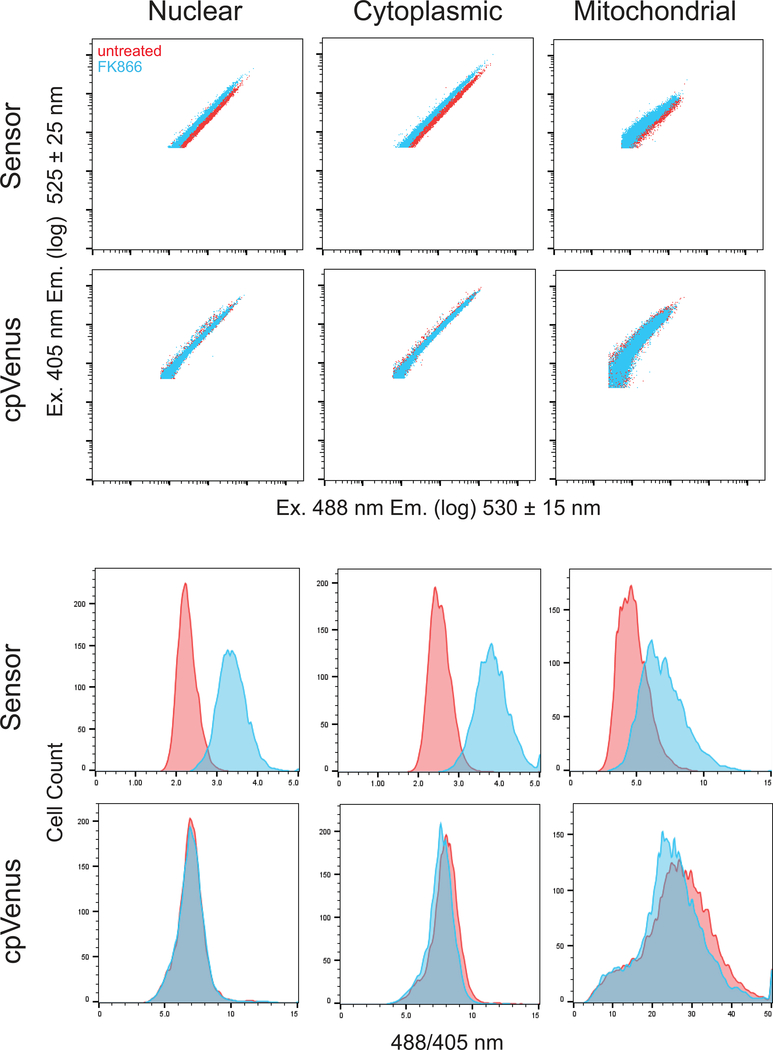
Fig. 5. Representative data from cytometry measurements.
(Top) Logarithmic dot-plot fluorescent measurements of ~10 000 cells in P3 that have been transfected with plasmids expressing either the sensor or cpVenus, as indicated. Each column represents data determined from the indicated subcellular compartment. x-axis, fluorescence following 405 nm excitation; y-axis, fluorescence following 488 nm excitation. (Bottom) Histograms showing the distribution of the same P3 population as a function of the 488/405 nm ratio per cell. Data was collected on a BD LSRII flow cytometer and analyzed on FlowJo V10 software.

