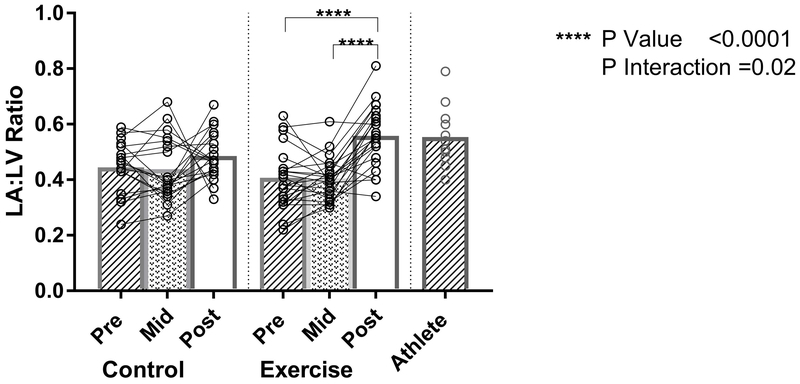
Figure 4: Ratio of Left Atrial to Left Ventricular End Diastolic Volume.
Individual Exercise, Control, and Athlete data points (open circles) with mean values (bar graphs). P-interaction reflects the mixed-effects modeling overall group × visit interaction between Exercise and Control groups. P-values indicate within-group pairwise comparisons between Exercise and Control groups. LA indicates left atrial; LV, left ventricle.

