
Figure 10.
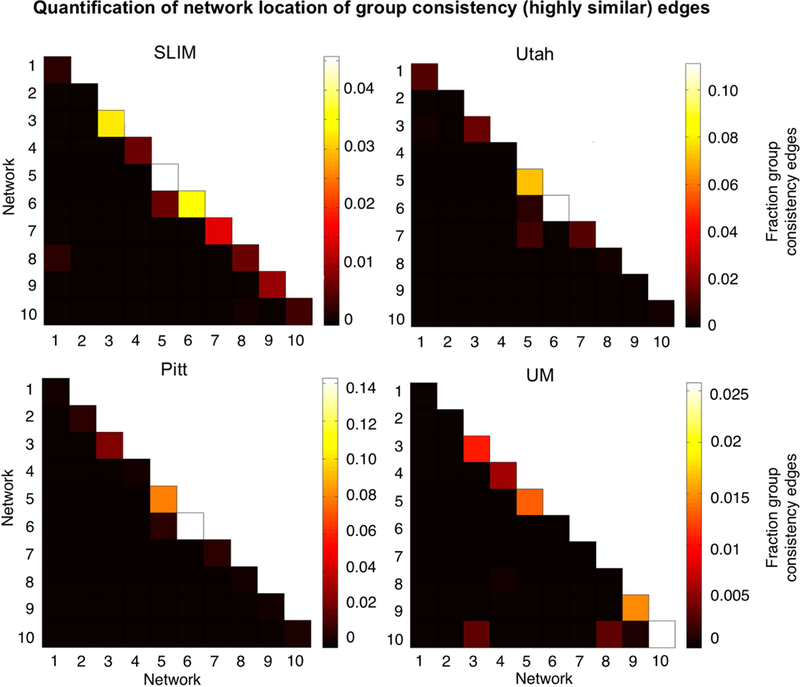
Network representation of group consistency (highly similar) edges in low-motion subjects. Here we are quantifying the network location of the data shown in Figure 9 (i.e. these are the 99.9 percentile most similar edges). Hotter colors indicate more edges are in the network pair; if an element in the matrix is black it indicates no edges were in this network pair. Results are shown for session 1 – session 2. Note that the color bars are not necessarily the same for all datasets. Note also that we considered Utah session 2a as session 2; for UM we considered session1a as session 1 and session 2a as session 2.