
Figure 4.
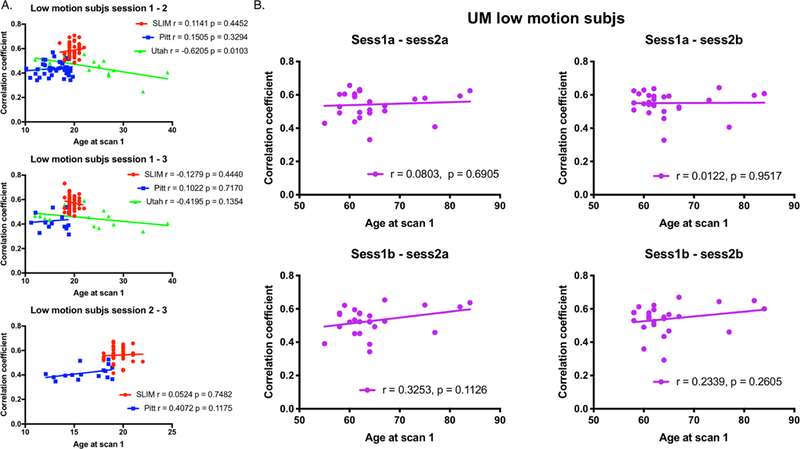
Plotting self-correlation against age at scan 1 for low-motion subjects. Panel A: Results for SLIM, Pitt, and Utah. SLIM is represented by red circles; Pitt is represented by blue squares; Utah is represented by green triangles. Panel B: Results for UM. Both panels: On the x-axis in both panel A and B is the age of a subject at scan 1. On the y-axis is the within-subject correlation coefficient (see Methods for details about calculating the within-subject correlation coefficient). The scan pair of interest (e.g. the target scan and the database scan) used in the identification process is indicated above each plot. Each plot also contains the results of correlation analyses for each dataset (r = Pearson correlation coefficient; p = P-value). Note that in Panel A for Utah we considered session 2a as session 2 and session 2b as session 3.