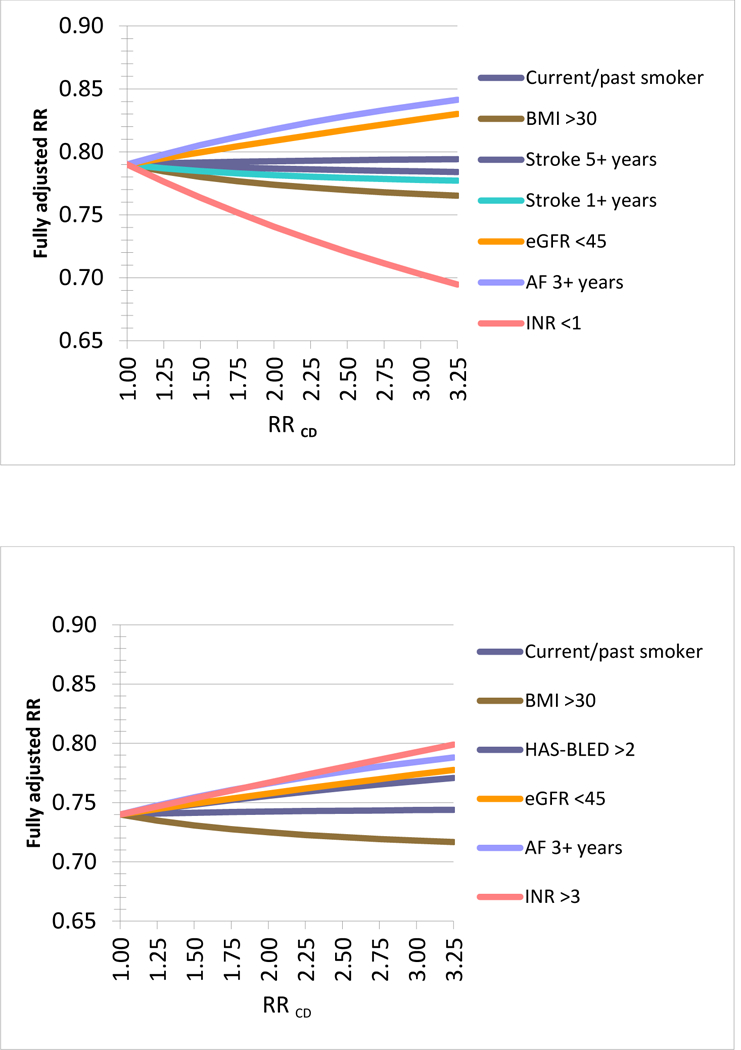
Figure 2. Quantitative bias analysis based on the observed residual differences in key clinical parameters*, 2a) Stroke: Dabigatran vs. warfarin, assuming HR = 0.79, 2b) Major hemorrhage: Dabigatran vs. warfarin, assuming HR = 0.74,

*Using the observed residual difference in key clinical parameters and assuming a hypothetical observed (apparent) relative risk (aRR) of 0.79 from the claims data analysis these graphs plot the changes in RR for a range of associations between the clinical parameter observed in the EHR data and the hypothetical outcome (RRCD). The RRCD values reach from a non-association of RRCD=1 to strong associations of 3.25 for each clinical parameter. For example, if the duration of AF of 3 year or longer would truly increase the risk of the outcome by 50% (RRCD=1.5) then the observed RR in claims data would truly be 0.82 instead of 0.79 (Panel 2a). Overall the resulting changes are minor under plausible assumptions of RRCD and may even cancel each other out depending on the correlation between the observed clinical parameters, for example the duration of existing AF may be correlated with the chance of being obese. An Excel spread sheet to conduct this analysis is available at: www.drugepi.org/dope-downloads/#Sensitivity Analysis *Stroke 1+ and 5+ years refer to duration since earliest recording of stroke in the EHR prior to treatment initiation *HAS-BLED Score: Labile INR defined as most recent INR <2 or >3 prior to cohort entry
