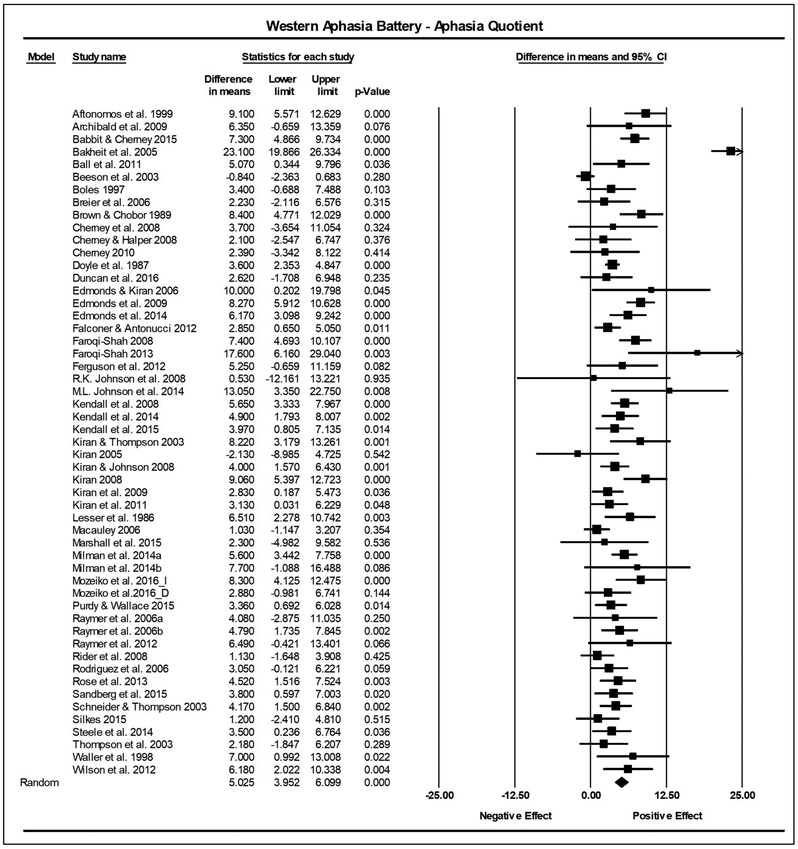
Figure 2.
Summary effect sizes for within group studies reporting the Western Aphasia Battery-Aphasia Quotient (WAB-AQ). The difference in means column reflects the pre-treatment mean subtracted from the post-treatment mean. The lower and upper limits columns show the 95% confidence interval surrounding the difference in means. The p-value indicates the significance of the effect. The final row describes the summary effect size, 95% confidence interval, and p-value. The diamond represents the summary effect size. The squares reflect effect sizes of individual studies.

