
Figure 5.
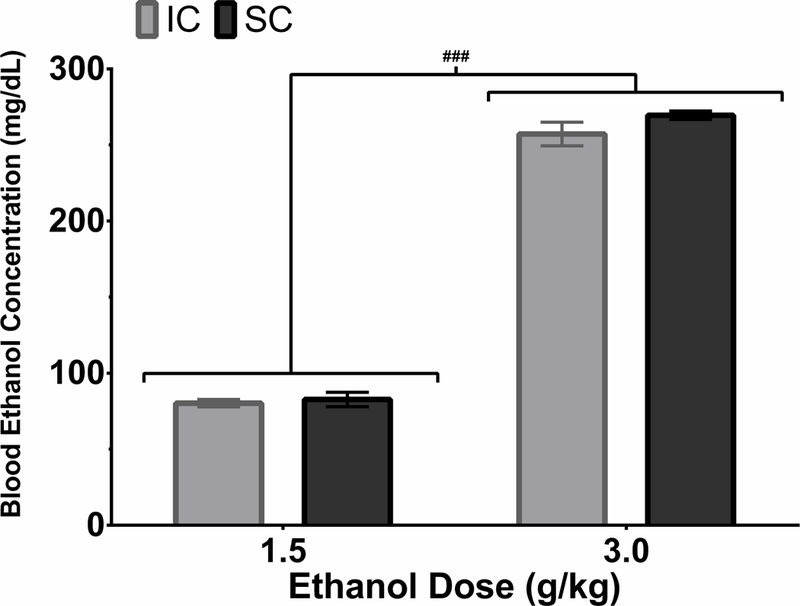
Mean blood ethanol concentrations (BECs; ± S.E.M.) in IC (light grey) and SC (dark grey) rats which reared from PND 21–51 and then received 1.5 g/kg of 20% ethanol (w/v) i.p. followed 6 days later by 3.0 g/kg of 20% ethanol i.p. Blood samples were collected 2 hours after each injection. The 3.0 g/kg dose induced higher BECs compared to the 1.5 g/kg dose. IC and SC rats had similar BECs at both doses. ###p < .001 between the two doses.