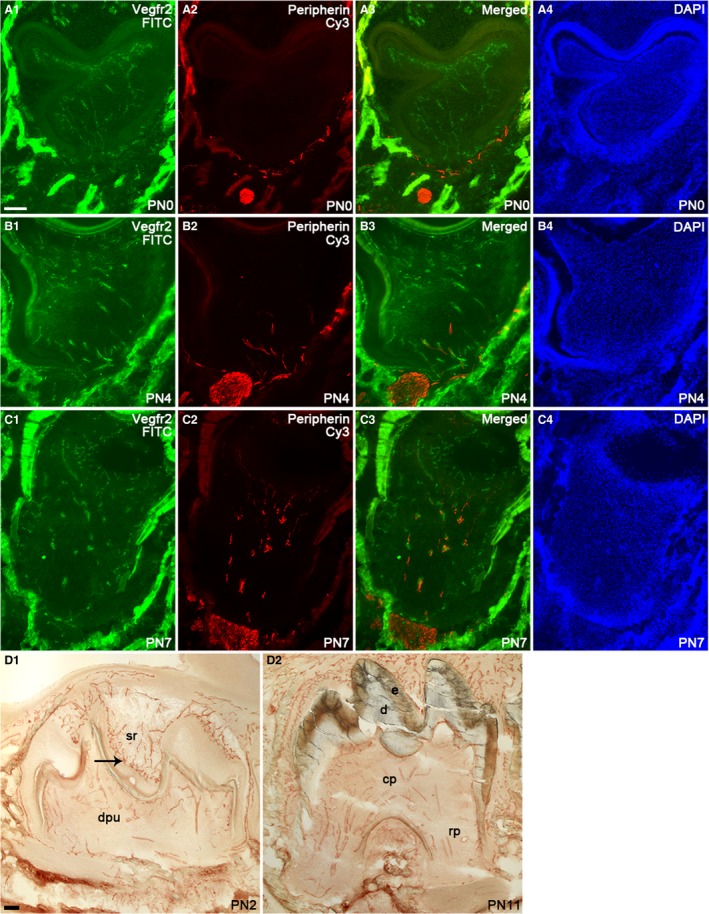
Figure 2.

Localization of blood vessels and nerve fibers in the mouse mandibular first molar tooth germ at postnatal stages PN0, PN4 and PN7 detected by immunofluorescence using anti‐VEGFR2 and anti‐peripherin antibodies, respectively (A1–C4). At PN2 and PN11, blood vessel distribution in the tooth germ is displayed by immunohistochemistry with anti‐VEGFR2 antibody (D1–D2). Images are shown in the FITC channel (A1, B1, C1), Cy3 channel (A2, B2, C2), merged channels (A3, B3, C3) and DAPI channel (A4, B4, C4). Scale bar in (A1): 100 μm; applies to A1–D2.
