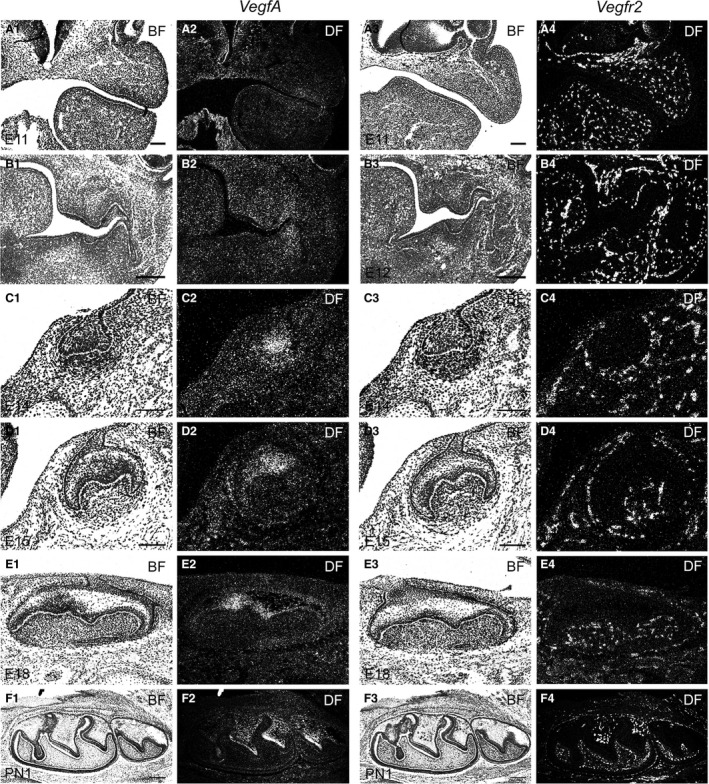
Figure 4.

Bright‐ (A1, A3, B1, B3, C1, C3, D1, D3, E1, E3, F1, F3) and dark‐field (A2, A4, B2, B4, C2, C4, D2, D4, E2, E4, F2, F4) images of E11, E12, E14, E15, E18 and PN1 tooth germs showing VEGF and VEGFR2 mRNA expression in the developing mandibular first molar tooth germ and neighbouring tissues. Coronal (A1–D4) and sagittal (E1–F4) sections. Scale bars: (A1–A4,C1–D4) 100 μm, (B1–B4,F1–F4) 200 μm.
